
Market basket analysis can feel like a technical maze, but its impact on e-commerce is unmistakable. Some online stores have raised their average order value by more than 10 percent just by using product pairing insights. Most people think this is all about complicated software or advanced analytics. The truth is, unlocking higher revenue actually starts with just a few strategic steps that any store owner can master.
Table of Contents
- Step 1: Define Your Objectives And Key Metrics
- Step 2: Gather And Prepare Transaction Data
- Step 3: Select Appropriate Analysis Tools And Techniques
- Step 4: Execute Market Basket Analysis
- Step 5: Interpret Results And Identify Actionable Insights
- Step 6: Implement Changes And Monitor Performance
Quick Summary
| Key Point | Explanation |
|---|---|
| 1. Define clear objectives | Establish specific growth goals for your market basket analysis to guide data examination and insights. |
| 2. Prepare structured transaction data | Collect and clean your sales records into a usable format for analysis, ensuring quality and relevance. |
| 3. Select the right analysis tools | Choose tools and methods that facilitate deep insights from your data, ranging from basic to advanced techniques. |
| 4. Translate insights into strategies | Convert analysis findings into actionable business strategies to enhance revenue, like product bundling. |
| 5. Monitor performance continuously | After implementation, track your changes’ impact on sales metrics to refine strategies regularly. |
Step 1: Define Your Objectives and Key Metrics
Launching a market basket analysis requires a strategic blueprint that transforms raw sales data into profit-driving insights. Your first critical task is establishing crystal clear objectives that align precisely with your e-commerce growth goals. Think of this step as creating a surgical roadmap for understanding customer purchasing behaviors and uncovering hidden revenue opportunities.
Successful market basket analysis begins with defining specific, measurable metrics that will guide your entire investigation. Your primary objectives might include increasing average order value (AOV), identifying complementary product combinations, reducing cart abandonment rates, or optimizing product placement strategies. Each objective serves as a strategic lens through which you’ll examine your sales data.
To kickstart this process, collect historical transaction data that represents a comprehensive view of your store’s performance. Aim for a dataset spanning at least three to six months, which provides sufficient depth to reveal meaningful patterns. Learn more about effective data collection strategies for e-commerce to ensure you’re capturing the most relevant information.
While selecting your key metrics, consider both quantitative and qualitative indicators. Quantitative metrics might include total transaction count, average basket size, product cross-purchase frequencies, and revenue per transaction. Qualitative metrics could involve understanding customer segmentation, identifying seasonal purchasing trends, and recognizing potential product bundling opportunities.
Verification becomes crucial in this initial stage. Your analysis objectives should pass a simple litmus test: they must be specific, measurable, actionable, relevant, and time-bound (SMART). Ask yourself: Can these metrics genuinely drive meaningful business decisions? Will they provide actionable insights that translate directly into increased revenue?
By meticulously defining your market basket analysis objectives, you transform data from a passive record into an active strategic tool. Each metric becomes a signal pointing toward untapped growth potential within your e-commerce ecosystem.
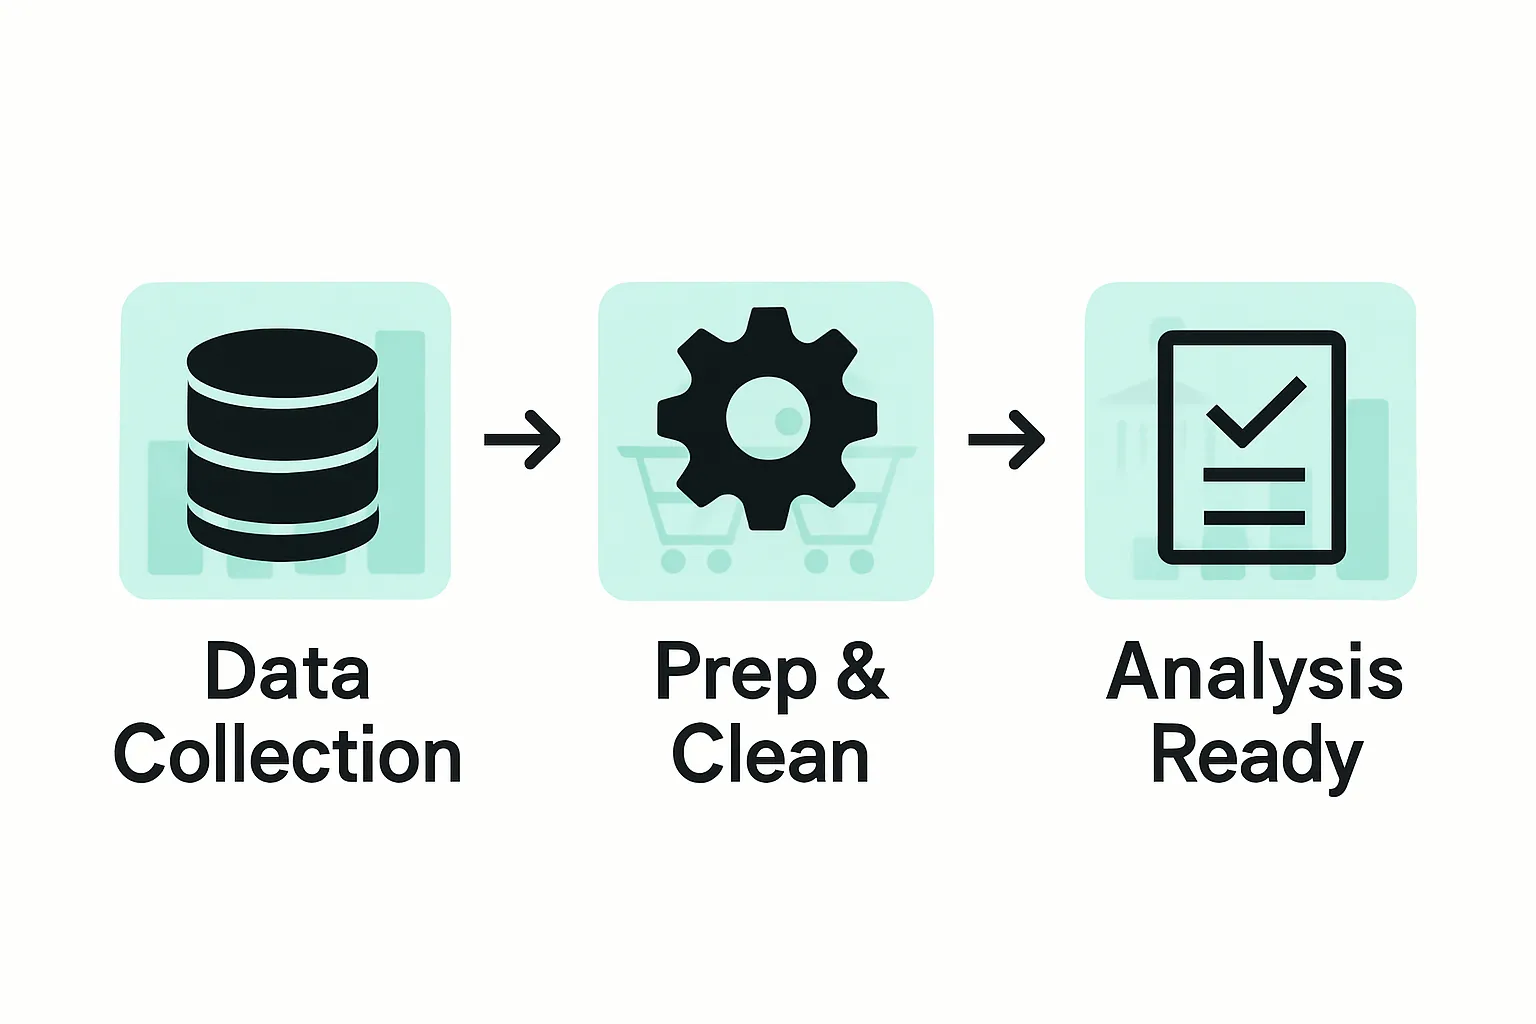
Step 2: Gather and Prepare Transaction Data
Transaction data serves as the foundational architecture for your market basket analysis, representing the raw material from which powerful insights emerge. Your goal in this critical phase is transforming scattered sales records into a structured dataset primed for meaningful examination. This process requires precision, attention to detail, and strategic data collection techniques that capture the nuanced purchasing behaviors of your customers.
Begin by consolidating transaction records from all available sources within your e-commerce ecosystem. This typically includes your primary sales platform, payment gateways, inventory management systems, and any supplementary sales channels. Comprehensive data collection means capturing every transaction detail: product identifiers, purchase timestamps, quantities, customer segments, and transaction values. According to research on transaction data preprocessing, clean and structured data is fundamental to generating reliable market basket analysis insights.
Data preparation involves several sophisticated yet manageable steps. Start by standardizing your data format to ensure consistency across different sources. This might require manual alignment or using data transformation tools that can reconcile variations in product naming, pricing, and categorization. Pay special attention to eliminating duplicate entries, handling missing values, and removing outliers that could skew your analysis results.
Convert your raw transaction logs into a format conducive to market basket analysis. Most analysts prefer a wide, sparse matrix where each row represents a unique transaction and columns represent individual products. Specialized spreadsheet software or programming languages like Python and R offer robust capabilities for this transformation. Create unique transaction identifiers and normalize product names to prevent fragmentation in your analysis.
Verification becomes crucial at this stage. Your prepared dataset should demonstrate data integrity through several key characteristics: completeness of records, elimination of redundant information, consistent product categorization, and a representative sample that genuinely reflects your store’s sales patterns. A well-prepared dataset becomes the strategic lens through which you’ll uncover hidden product relationships and purchasing dynamics that can dramatically enhance your revenue strategies.
Here is a checklist summarizing the key data preparation and verification requirements for effective market basket analysis, allowing you to confirm your dataset’s readiness at a glance.
| Step or Requirement | Description |
|---|---|
| Consolidate transaction records | Gather data from all sales platforms, gateways, and inventory systems |
| Standardize data formats | Align product naming, pricing, and categorization for consistency |
| Eliminate duplicates | Remove repeated transaction entries to prevent skewed analysis |
| Handle missing values | Address incomplete records to maintain data integrity |
| Remove outliers | Exclude transactions that could distort results |
| Structure as transaction matrix | Ensure data is formatted with unique transaction and product columns |
| Verify completeness and consistency | Check dataset represents typical sales and product categories |
Step 3: Select Appropriate Analysis Tools and Techniques
Selecting the right analysis tools transforms your market basket analysis from a theoretical exercise into a powerful revenue generation strategy. Your choice of analytical techniques will determine the depth and actionability of insights extracted from your transaction data. Explore advanced sales analysis strategies to complement your market basket investigation.
The landscape of market basket analysis tools ranges from basic spreadsheet calculations to sophisticated machine learning algorithms. For small to medium e-commerce stores, start with accessible solutions that balance complexity and usability. Statistical methods like association rules mining and apriori algorithms offer foundational insights into product relationships. These techniques help identify which products are frequently purchased together, revealing natural customer purchasing patterns that can inform merchandising and promotional strategies.
Programming environments such as Python and R provide robust, free platforms for conducting advanced market basket analyses. Libraries like mlxtend in Python and arules in R offer specialized functions for generating association rules, calculating support and confidence metrics, and visualizing product co-occurrence networks. These tools enable you to move beyond simple descriptive statistics and uncover nuanced purchasing dynamics.
For e-commerce merchants seeking more turnkey solutions, specialized analytics platforms can streamline the analysis process. Look for tools that integrate directly with your existing sales platforms, offering real-time insights and automated reporting. Key features to prioritize include visual rule generation, predictive recommendation engines, and the ability to export detailed findings for further strategic planning.
Verification of your selected analysis approach involves assessing several critical factors. Evaluate your chosen method’s ability to generate actionable insights, handle the scale of your transaction data, provide clear visualizations, and align with your specific business objectives. The right tool should not just produce data but translate complex purchasing patterns into clear, implementable marketing and inventory strategies that directly impact your bottom line.
This table compares common market basket analysis tools and techniques mentioned in the guide, highlighting each option’s strengths and suitable use cases for e-commerce businesses.
| Tool or Method | Complexity | Best For | Key Features |
|---|---|---|---|
| Spreadsheet Calculations | Low | Beginners, small datasets | Manual association rules, easy setup |
| Association Rules (Apriori algorithm) | Medium | Foundation insights, all business sizes | Discovers frequent product combinations |
| Python (mlxtend library) | Medium-High | Technical users, custom analysis | Flexible, automates calculation & visuals |
| R (arules package) | Medium-High | Data analysts, statistical depth | Advanced metrics, visualization options |
| Analytics Platforms (plug-ins/apps) | Low-Medium | Turnkey e-commerce integration | Automated rules, real-time dashboards |
Step 4: Execute Market Basket Analysis
Executing market basket analysis transforms your meticulously prepared data into actionable strategic insights that can revolutionize your e-commerce revenue approach. This phase represents the critical moment where raw transaction information becomes a powerful roadmap for understanding customer purchasing behaviors. Explore practical market basket analysis examples to guide your implementation strategy.
Begin by applying association rule mining techniques to uncover meaningful product relationships within your transaction dataset. Support and confidence metrics become your primary investigative tools, revealing which product combinations occur most frequently and with the highest probability. Support indicates the percentage of transactions containing specific product combinations, while confidence measures the likelihood of purchasing complementary items.
The execution process involves generating association rules that highlight significant product interactions. Advanced algorithms like Apriori help identify these relationships by systematically examining transaction patterns. Focus on rules with high support and confidence values, as these represent the most reliable and potentially profitable product connections. Your goal is uncovering natural purchasing synergies that can inform cross-selling strategies, product bundling, and strategic inventory management.
Implement visualization techniques to transform complex statistical findings into comprehensible insights. Network graphs and heat maps can illustrate product relationships, making it easier to understand intricate purchasing patterns.
These visual representations help translate abstract data points into concrete marketing strategies. Pay close attention to products with strong associations that might not be immediately obvious from traditional sales analysis.
Verification of your market basket analysis requires a comprehensive evaluation framework. Assess the practical significance of discovered associations by considering their potential business impact. Look beyond statistical metrics to understand how these insights can translate into tangible revenue opportunities. Successful execution means generating actionable recommendations that can be directly implemented in your e-commerce strategy, such as creating targeted product bundles, optimizing store layout, or developing personalized marketing campaigns that reflect natural customer purchasing behaviors.
Step 5: Interpret Results and Identify Actionable Insights
Interpreting market basket analysis results transforms complex statistical data into strategic revenue opportunities. This critical phase bridges the gap between raw numbers and meaningful business decisions. Explore essential sales analysis report insights to enhance your interpretation strategy.
Begin by examining association rules through a strategic business lens, focusing on metrics that demonstrate substantial economic potential. High confidence and support values indicate product combinations with genuine cross-selling opportunities. Look beyond mere statistical significance and consider the practical implications of each discovered relationship. For instance, a product pair with a 30% co-occurrence rate might represent a compelling opportunity for bundled promotions or strategic product placement.
Contextualize your findings by segmenting insights across different customer demographics, seasonal trends, and product categories. Some product associations might perform exceptionally well during specific periods or among particular customer groups. Understanding these nuanced patterns allows for targeted marketing strategies that speak directly to customer preferences. Analyze how different product combinations perform across various customer segments, revealing hidden opportunities for personalized recommendations and tailored promotional campaigns.
Translate statistical findings into concrete business strategies. Potential action items might include creating promotional bundles, redesigning store layouts to place frequently co-purchased items near each other, developing targeted marketing campaigns, or adjusting inventory management practices. Each insight should directly connect to a specific revenue-enhancing initiative that can be implemented immediately.
Verification of your interpretation involves a comprehensive assessment of potential business impact. Evaluate each discovered insight against key performance indicators like projected revenue increase, potential cost savings, and alignment with overall business objectives. The most valuable market basket analysis results are those that can be quickly transformed into measurable strategic actions, turning complex data into a clear roadmap for enhanced sales performance.
Step 6: Implement Changes and Monitor Performance
Implementing insights from market basket analysis transforms theoretical understanding into tangible revenue growth strategies. This pivotal phase requires a systematic approach to rolling out changes that capitalize on discovered product relationships and purchasing patterns. Explore advanced sales performance tracking techniques to complement your implementation strategy.
Begin by prioritizing your most impactful insights and developing a phased implementation plan. Not all discoveries can or should be implemented simultaneously. Start with high-confidence product combinations that promise immediate revenue potential. This might involve creating strategic product bundles, adjusting store layout to place complementary items near each other, or developing targeted cross-selling campaigns that reflect your market basket analysis findings.
Establish a robust monitoring framework that tracks the performance of each implemented strategy with precision. Utilize analytics tools that can provide real-time insights into how your changes impact key performance indicators. Pay close attention to metrics like average order value, conversion rates, and product-specific sales volumes. The goal is to create a dynamic feedback loop where implementation insights continuously inform and refine your strategy.
Anticipate and plan for potential implementation challenges. Some product recommendations may not perform as expected due to factors like seasonality, changing customer preferences, or unique market dynamics. Build flexibility into your approach, allowing for quick pivots and adjustments. Develop a systematic process for regularly reviewing and recalibrating your strategies based on ongoing performance data.
Verification of successful implementation involves a comprehensive performance assessment. Look beyond surface-level metrics to understand the deeper implications of your changes. Are the implemented strategies creating meaningful improvements in customer experience? Do they align with your broader business objectives? Successful market basket analysis implementation goes far beyond simple sales increases, ultimately creating a more intuitive and customer-centric shopping experience that drives long-term business growth.

Ready to Turn Data Into Sales? Unlock the Power of Advanced Market Basket Analysis
If you have struggled to make sense of scattered sales records or have felt uncertain about which product pairings can really lift your store’s revenue, you are not alone. As discussed in this guide, pinpointing actionable product relationships and boosting average order value can feel overwhelming without the right tools. Many store owners get stuck during data preparation or feel lost when trying to extract usable insights from complex analysis techniques.
You deserve a smarter way to convert your data into meaningful growth. At APUS NEST, you can upload your sales data, instantly discover high-confidence product pairings, and receive custom AI-driven recommendations that drive action. No subscription or hard-to-understand barriers. Start with a free report for a taste of hidden opportunities, then unlock full analytics when you are ready to maximize every single checkout. Your next profitable cross-sell or product bundle is just a click away. Take the first step by visiting APUS NEST or explore our product analysis strategies for even more data-driven ideas. Do not let another lost opportunity slip by. Act now and set your store on a path to consistent revenue gains.
Frequently Asked Questions
What is market basket analysis?
Market basket analysis is a data mining technique used to uncover patterns in customer purchasing behavior by identifying which products are frequently purchased together in transactions.
How can I use market basket analysis to increase average order value?
By identifying product combinations that customers frequently buy together, you can create targeted promotions and bundles that encourage customers to purchase more items, thus increasing the average order value.
What tools are best for conducting market basket analysis?
Tools vary from basic spreadsheets to advanced programming environments like Python and R. Depending on the complexity needed, you can use simple statistical methods like association rules or leverage specialized analytics platforms for real-time insights.
How do I prepare my transaction data for market basket analysis?
Prepare your transaction data by consolidating records from various sources, standardizing formats for consistency, eliminating duplicates, handling missing values, and structuring the data to clearly represent individual transactions and product identifiers.
Recommended
- Market Basket Analysis Example: A Step-By-Step Guide (2025) - ApusNest Blog | ApusNest
- Basket Analysis Guide: Techniques and Applications for 2025 - ApusNest Blog | ApusNest
- Market Basket Analytics Guide: Strategies for 2025 - ApusNest Blog | ApusNest
- Digital Marketing for Retailers: Proven Strategies for 2025 | Ibrandmedia