Imagine unlocking hidden connections in your sales data that could instantly boost your bottom line. That’s exactly what top retailers are doing with advanced analytics.
This guide breaks down the market basket analysis example you need to see, showing you—step by step—how to uncover actionable product relationships in 2025’s competitive landscape.
You’ll learn what market basket analysis is, why it’s crucial, how to prepare your data, and how to turn insights into profit. Get ready for practical tips, real-world applications, and a clear path to smarter, more profitable business decisions.
Understanding Market Basket Analysis
Unlocking hidden connections in your sales data can transform the way you approach retail strategy. A strong market basket analysis example shows how retailers use buying patterns to boost profits and personalize customer experiences. Let’s break down the fundamentals and see why this technique is essential for modern businesses.
What is Market Basket Analysis?
Market basket analysis is a data mining technique that uncovers product relationships based on customer purchase behavior. It originated in brick-and-mortar retail, where managers noticed patterns in items bought together. Over time, it became a cornerstone of e-commerce analytics.
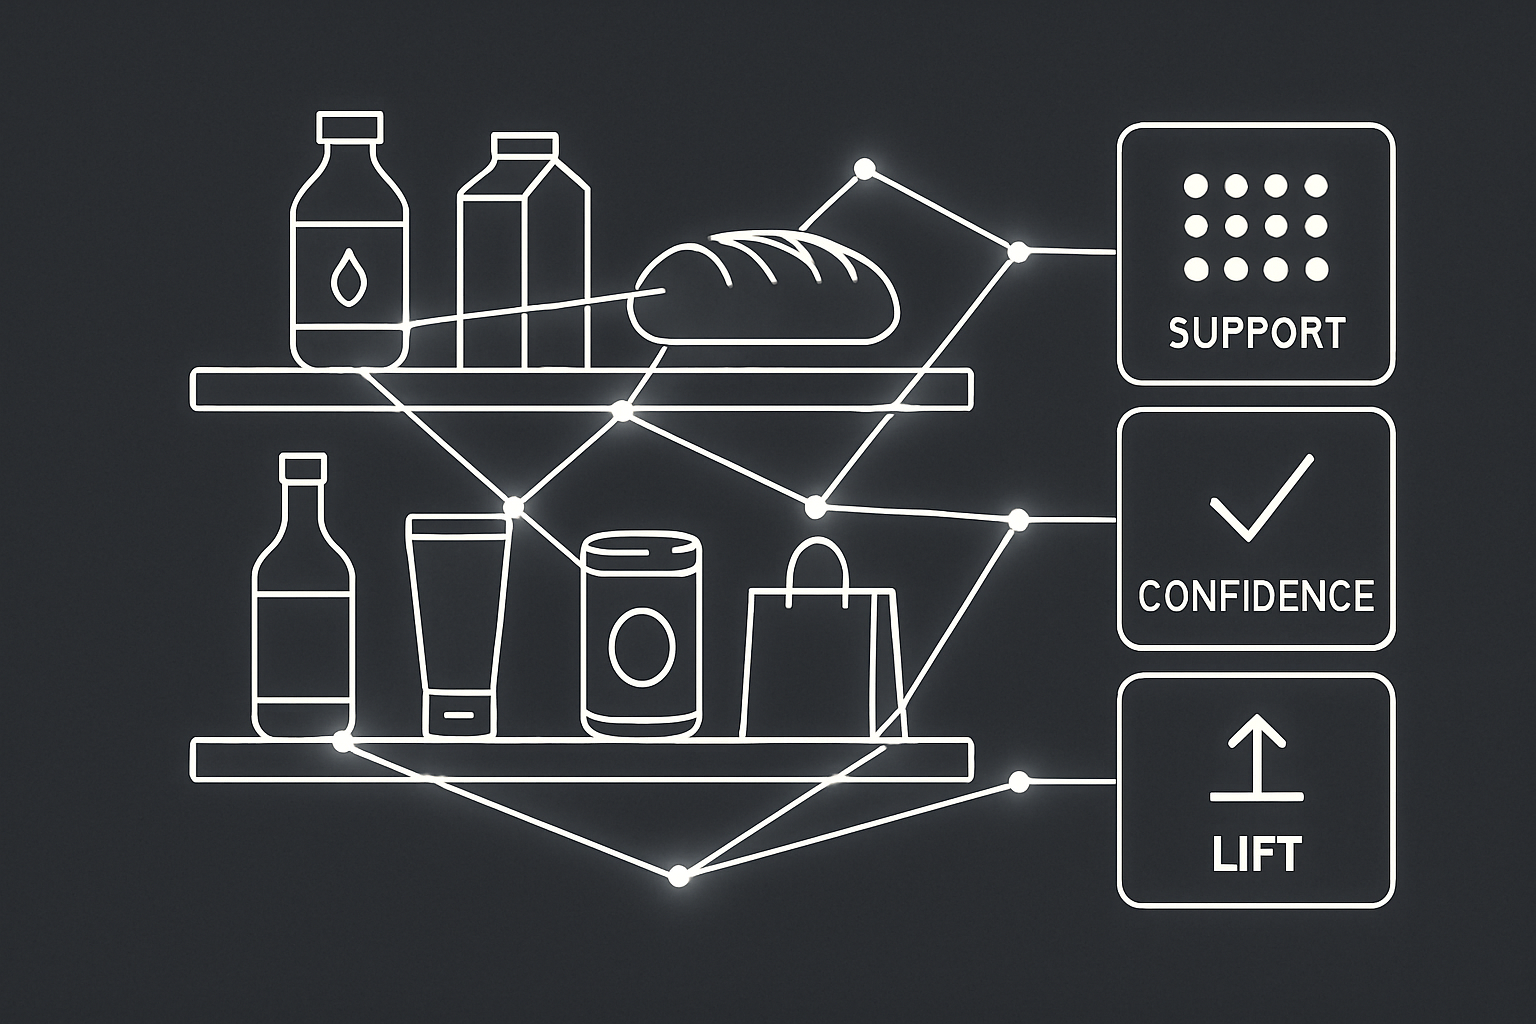
Key terms include association rules (e.g., "If bread, then butter"), support (how often items appear together), confidence (likelihood of co-purchase), and lift (strength of association). A classic market basket analysis example is the “diapers and beer” insight, where these items were frequently bought together. Today, this method fits seamlessly into broader data analytics strategies, revealing actionable insights from everyday transactions.
Why is Market Basket Analysis Important in 2025?
In 2025, AI and big data shape every aspect of retail analytics. According to Gartner (2023), 80% of top retailers leverage market basket analysis example insights for product recommendations. This approach supercharges cross-selling and up-selling, making marketing more personalized and effective.
Both online and offline businesses benefit, as the technique bridges digital and physical shopping behaviors. In a crowded e-commerce landscape, using a market basket analysis example provides a competitive edge by uncovering opportunities your rivals might overlook. The ability to act on these insights quickly can define your success in the market.
Common Use Cases and Benefits
Market basket analysis example applications span a wide range of business operations. Retailers use it to optimize product placement and store layout, ensuring high-demand items are positioned for maximum impact. It also drives smarter product bundling and targeted promotions.
Enhancing recommendation engines is another powerful use case, increasing relevance for the shopper. By understanding what customers buy together, businesses can reduce churn through better customer insights. For instance, a grocery chain increased average order value (AOV) by 18% after implementing a market basket analysis example, showcasing the tangible benefits of this approach.
Key Metrics and Concepts Explained
To make the most of a market basket analysis example, understanding its core metrics is vital:
| Metric | Definition | Example |
|---|---|---|
| Support | Frequency of itemsets in transactions | 15% of orders |
| Confidence | Likelihood that items are purchased together | 70% chance |
| Lift | Association strength beyond random chance | 2.5x more likely |
Support measures how often products appear together. Confidence shows the chance that a customer who buys one item will also buy another. Lift reveals whether the association is stronger than random chance.
For a deeper dive into how these metrics work in practice, see this Market Basket Analysis Techniques and Applications resource. Focusing on actionable insights, rather than just raw data, ensures your market basket analysis example delivers real business value.
Preparing Your Data for Market Basket Analysis
Preparing your data is the foundation for any successful market basket analysis example. Without accurate, well-organized data, even the most advanced algorithms can produce misleading insights. Let's break down each step to ensure your data is analysis-ready.
Gathering Transaction Data
The first step in any market basket analysis example is collecting comprehensive transaction data. You'll need details such as sales receipts, order history, and timestamps for each purchase.
Common sources include:
- Point-of-sale (POS) systems in brick-and-mortar stores
- E-commerce platforms like Shopify or WooCommerce
- CSV exports from internal databases
Aim for a data volume that ensures statistical significance—thousands of transactions are ideal. Always consider privacy and compliance; anonymize personal information to stay in line with regulations like GDPR or CCPA.
Cleaning and Formatting Data
Raw data is rarely perfect. For a reliable market basket analysis example, start by removing duplicate transactions and correcting obvious errors. Next, standardize product names and SKUs so similar items are grouped correctly.
Missing or incomplete data should be addressed, either by filling gaps or excluding problematic entries. For instance, a messy CSV export may look like this:
TransactionID,Product,Date
1001,Red Apples,2025-01-03
1002,Red  Apples,2025-01-03
1003,,2025-01-04
After cleaning, products are consistent and missing entries are resolved, providing a solid foundation for analysis.
Choosing the Right Tools and Software
Selecting the right tools is crucial for a seamless market basket analysis example. Options range from spreadsheet applications to advanced AI-powered platforms. Popular choices include Python with mlxtend and pandas, R with arules, and automated SaaS tools.
Key criteria:
- Ease of use
- Scalability for large datasets
- Integration with your existing systems
According to Forrester (2024), 60% of businesses now use automated tools rather than manual methods. Here’s a quick comparison:
| Tool | Ease of Use | Scalability | Integration |
|---|---|---|---|
| Excel | High | Low | Medium |
| Python | Medium | High | High |
| R | Medium | High | Medium |
| SaaS (AI) | High | High | High |
ApusNest: AI-Powered Market Basket Analysis
For those seeking a streamlined market basket analysis example, ApusNest offers an AI-powered solution designed for e-commerce businesses. ApusNest automates data cleaning, analysis, and report generation, saving valuable time.
Key benefits include:
- Actionable recommendations tailored to your sales data
- Compatibility with platforms like Shopify, WooCommerce, and CSV imports
- A one-time payment model and a free introductory report
- Fast setup, full data privacy, and ownership
With ApusNest, you can focus on interpreting results, not wrestling with data prep.
Ensuring Data Quality and Integrity
Maintaining high data quality is essential for a trustworthy market basket analysis example. Regular audits and validation routines help catch errors early. Outdated or inaccurate data can skew association rules, leading to poor business decisions.
Consider this: a single misclassified product can change the top product pairings and distort recommendations. Make data audits a routine part of your workflow to ensure every analysis drives meaningful, actionable insights.
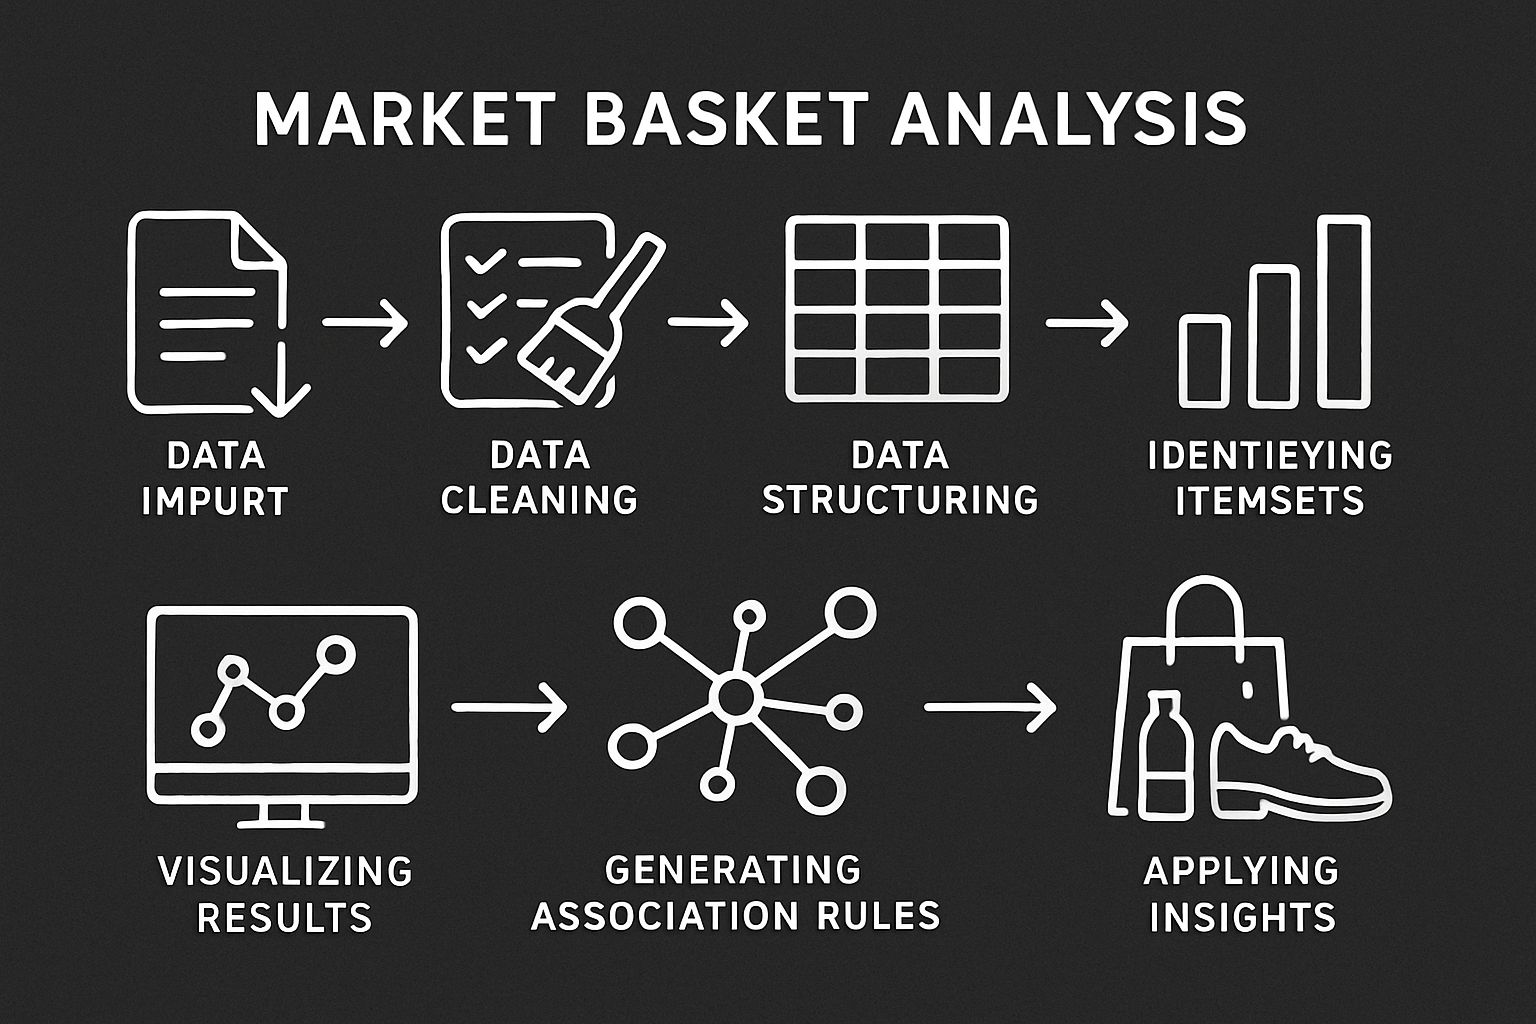
Step-By-Step Guide: Conducting Market Basket Analysis
Unlocking value from your sales data starts with a clear market basket analysis example. Let’s walk through each critical step, using practical tools and concepts to help you turn raw transactions into actionable business insights.
Step 1: Import and Structure Your Data
Start every market basket analysis example by gathering your transaction data. This typically comes from POS systems, ecommerce platforms, or CSV exports.
Organize your data so each row represents a single transaction and lists all items purchased together. For most tools, you’ll want a “basket” format.
Example Table:
| Transaction ID | Items Purchased |
|---|---|
| 1001 | Bread, Milk, Butter |
| 1002 | Diapers, Beer, Chips |
| 1003 | Bread, Diapers, Eggs |
A well-structured dataset is essential. Common pitfalls include inconsistent product names, missing transaction IDs, or duplicate records. Always review your data for these issues before moving forward.
Step 2: Identify Itemsets and Transaction Patterns
Now, use your chosen tool—spreadsheet, Python, or AI platform—to extract frequent itemsets. An itemset is a group of products bought together in a single transaction.
Set a minimum support threshold to filter out combinations that appear too infrequently. For a market basket analysis example, you might focus on pairs (“Bread & Butter”) or triples (“Bread, Milk & Eggs”).
Top 5 Frequent Itemsets:
| Itemset | Support (%) |
|---|---|
| Bread, Milk | 12 |
| Diapers, Beer | 10 |
| Milk, Eggs | 8 |
| Chips, Soda | 7 |
| Bread, Butter | 6 |
Spotting these patterns helps you focus on the product combinations that matter most for your business.
Step 3: Generate Association Rules
With frequent itemsets identified, the next step in your market basket analysis example is generating association rules. These rules show relationships like “If a customer buys X, they’re likely to buy Y.”
Popular algorithms include Apriori and FP-Growth. Set minimum thresholds for confidence and lift to ensure you only keep meaningful associations.
Sample Output:
Rule: {Diapers} -> {Beer}
Support: 10%
Confidence: 65%
Lift: 1.7
This means 65% of transactions with diapers also include beer, and the lift suggests this pairing is much stronger than random chance.
Step 4: Interpret and Validate Results
Don’t just accept every rule—interpret them within your business context. Focus on rules with high support, confidence, and lift.
Visualizing results can clarify complex associations. Try heatmaps or network diagrams to see how products cluster together. Filtering out trivial or spurious associations is crucial in any market basket analysis example.
For instance, you might find a strong connection between “Phone Case” and “Screen Protector,” but a weak or random link between “Eggs” and “Batteries.” Prioritize actionable insights.
Step 5: Apply Insights to Business Decisions
Now, translate your findings into business actions. Bundle products with strong associations, create targeted promotions, or adjust store layouts.
A practical market basket analysis example: A retailer discovers that pairing “Yoga Mats” with “Water Bottles” in a promotion increases cross-sell rates by 22%. Test these strategies through A/B testing before rolling them out fully.
Track the impact on sales metrics like average order value or conversion rate to measure success.
Step 6: Iterate and Refine Analysis
Market trends, seasonality, and new products mean that your analysis should never be one-and-done. Run your market basket analysis example regularly—monthly or quarterly is a good cadence.
Update your data and rules to capture changes. Many businesses automate this process using AI-powered tools, letting you spot shifts in buying behavior quickly. For those ready to level up, explore advanced market basket analysis strategies to uncover deeper patterns and drive even greater value.
Track year-over-year improvements to stay ahead of competitors.
Troubleshooting Common Challenges
Every market basket analysis example comes with hurdles. Sparse or inconsistent data can lead to weak associations. Overfitting is a risk if you focus too much on rare patterns.
- Ensure your data is clean and complete.
- Watch for misleading associations—just because two items appear together doesn’t mean a meaningful relationship exists.
- Focus on insights that drive action, not just interesting facts.
If a rule seems odd (like “Eggs” and “Batteries”), dig deeper before acting. Quality analysis leads to quality decisions.
Real-World Market Basket Analysis Example
Understanding how theory translates into practice is crucial, so let’s dive into a real-world market basket analysis example from 2025. This hands-on look will show how a mid-sized retailer used data-driven insights to unlock growth. Each step demonstrates how actionable analytics can transform business results.
Case Study Overview
In this market basket analysis example, we examine a mid-sized online retailer focused on electronics and accessories. By early 2025, the retailer wanted to increase average order value (AOV) and deliver smarter product recommendations.
The business operated across both its website and mobile app, serving thousands of tech-savvy shoppers each month. With competition intensifying, leadership turned to advanced analytics for a competitive edge. Their primary goals for the market basket analysis example were to uncover hidden buying patterns and identify new cross-sell opportunities.
Step-by-Step Walkthrough with Data
The market basket analysis example started with a dataset of 10,000 transactions collected during Q1 2025. Each transaction included a timestamp, customer ID, and a list of purchased items.
Key product categories in this dataset included phone accessories, smart home devices, and wearable tech. After cleaning and formatting the data, analysts structured it so each row represented a single transaction and all items bought together.
Using this organized data, the team ran the market basket analysis example to identify frequent itemsets. This process set the stage for discovering strong product associations.
Key Findings and Association Rules
The market basket analysis example uncovered several high-value associations. Analysts used support, confidence, and lift to measure the strength of these rules.
| Product Pair | Support | Confidence | Lift |
|---|---|---|---|
| Phone Case & Screen Protector | 12% | 54% | 2.1 |
| Smartwatch & Wireless Earbuds | 7% | 42% | 1.8 |
| Laptop Bag & Mouse | 6% | 35% | 1.5 |
These findings revealed that customers who purchased a phone case frequently added a screen protector to their cart. Visualizing these associations helped the team spot new bundling opportunities within this market basket analysis example.
Actions Taken and Business Impact
Based on the market basket analysis example, the retailer implemented several key actions:
- Bundled top product pairs, like phone cases and screen protectors, into combo offers.
- Launched targeted email campaigns promoting related items.
- Optimized product recommendations on checkout pages.
After these changes, the retailer saw a 15% increase in average order value and a 10% rise in conversion rate. For more tips on achieving similar results, see Increase average order value with basket analysis. Continuous analysis ensured strategies remained effective as trends shifted.
Lessons Learned and Best Practices
This market basket analysis example highlights the importance of maintaining high data quality and performing regular audits. Leveraging AI-powered tools made the analysis faster and easier to scale.
Cross-functional collaboration between analytics, marketing, and merchandising teams was key for turning insights into action. By following these best practices, the retailer maximized the impact of their market basket analysis example and built a sustainable path for ongoing growth.
Advanced Tips and Future Trends in Market Basket Analysis
Ready to take your market basket analysis example to the next level? The future is bright for businesses willing to embrace AI, automation, and data-driven strategy. Let’s break down the trends and tips shaping success in 2025 and beyond.
Leveraging AI and Automation
AI continues to transform the market basket analysis example, making it faster and smarter. Modern platforms use machine learning to uncover hidden product relationships in real time, predicting what customers will likely buy next. Automated engines now deliver personalized product bundles, adapting instantly to changing consumer behavior.
Retailers are combining AI with transactional data for dynamic, on-the-fly recommendations. For a deeper dive into how this drives ecommerce growth, check out Market basket analysis for ecommerce growth.
As algorithms evolve, expect even greater accuracy in forecasting and bundling strategies—giving businesses a powerful edge.
Integrating Market Basket Analysis with Other Analytics
A robust market basket analysis example doesn’t exist in isolation. Leading businesses integrate these insights with customer segmentation, lifetime value (CLV), and RFM (recency, frequency, monetary) analysis for a holistic view.
Combining these analytics empowers retailers to fine-tune marketing, personalize offers, and optimize inventory across channels. Multi-channel campaign optimization becomes possible when you merge basket findings with broader datasets.
If you’re interested in how these techniques extend beyond the cart, Market basket analysis beyond the cart explores advanced applications and strategic integration.
Addressing Privacy and Ethical Considerations
In 2025, a market basket analysis example must account for evolving privacy laws. Regulations like GDPR and CCPA require businesses to handle purchase data responsibly, ensuring transparency and customer trust.
Ethical use means leveraging data for recommendations without invading privacy. Always anonymize sensitive information, inform customers about data use, and offer easy opt-out options.
Prioritizing privacy not only keeps you compliant but also strengthens your brand’s reputation in a data-conscious marketplace.
Emerging Trends and Technologies
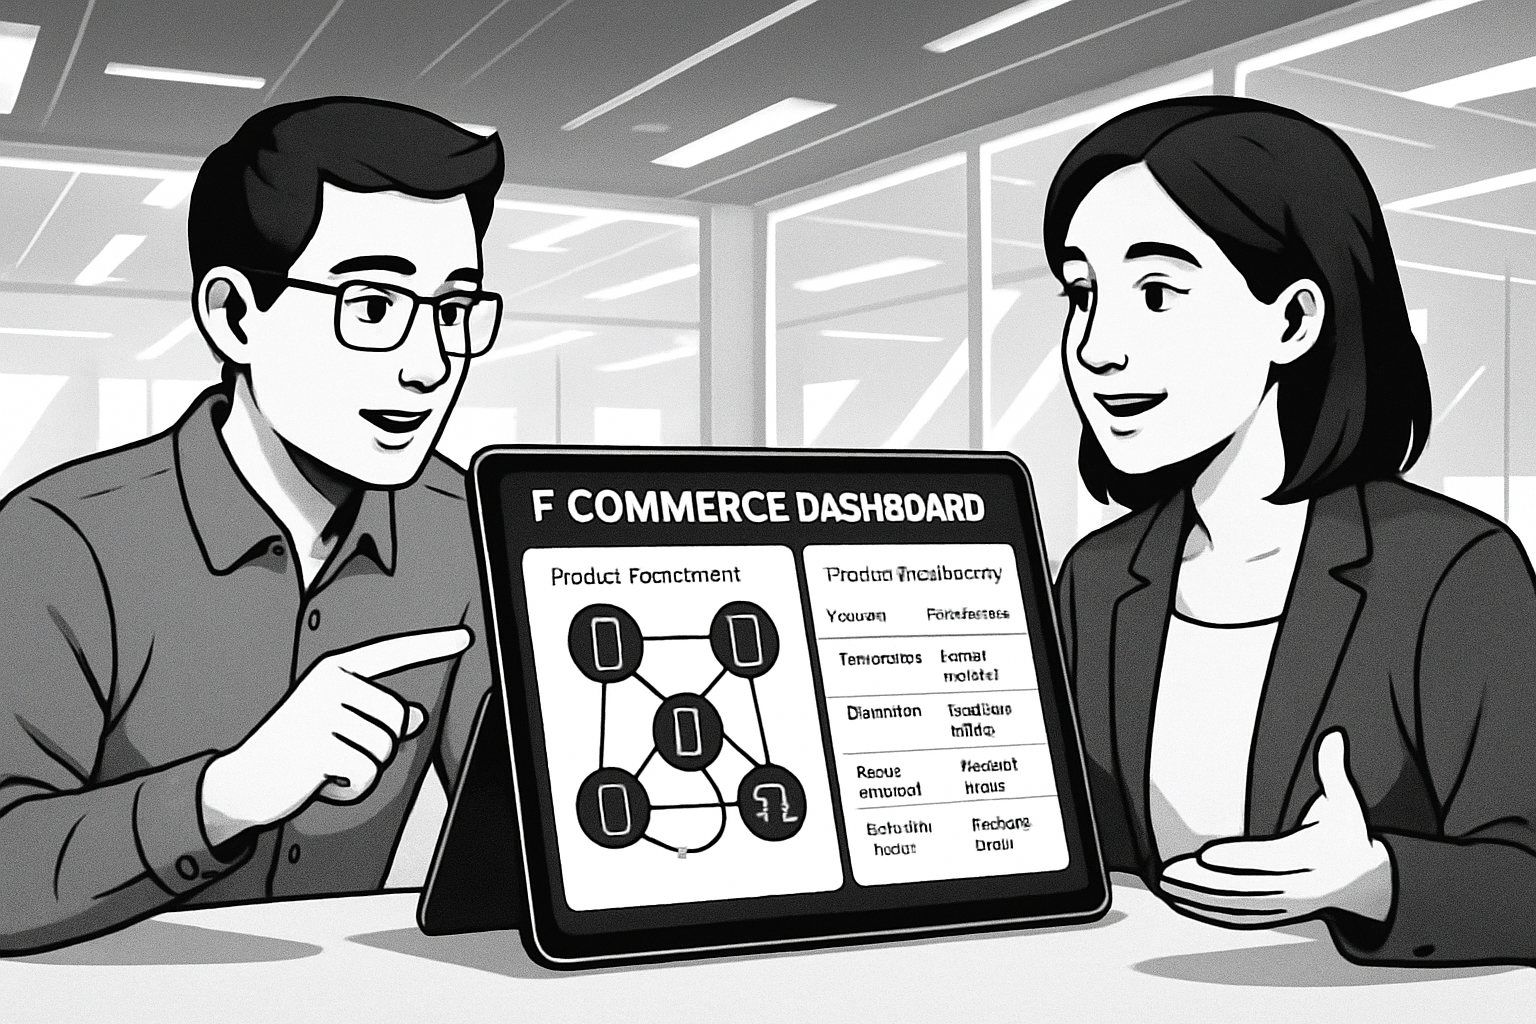
Several trends are reshaping the market basket analysis example. Real-time analytics are now common, enabling dynamic pricing and instant offers. Interactive dashboards let teams visualize associations and act quickly.
AI-driven visual analytics make it easier to spot patterns and share insights company-wide. According to Deloitte, 70% of enterprise retailers plan to adopt real-time basket analysis by 2026, underscoring the momentum behind these innovations.
Stay alert for advances in deep learning models, which will further personalize recommendations and streamline the shopper journey.
Actionable Strategies for 2025 and Beyond
To future-proof your market basket analysis example, focus on continuous improvement. Update association rules regularly as your product mix evolves. Collaborate across marketing, analytics, and merchandising teams to drive real results.
Invest in user-friendly, AI-powered analysis tools to maintain agility as customer preferences shift. Here are actionable strategies:
- Schedule monthly or quarterly analysis refreshes
- Integrate insights with loyalty and CRM programs
- Test new bundles and promotions using A/B experiments
By embedding these habits, you’ll ensure your analysis remains relevant, actionable, and profitable.