Did you know that mastering basket analysis could be the key to boosting your sales in 2025? As data-driven strategies become essential in retail and e-commerce, understanding which products customers buy together is more valuable than ever.
Basket analysis helps uncover hidden buying patterns, allowing businesses to optimize product recommendations, improve store layouts, and launch smarter marketing campaigns. Leading brands are already using these insights to stay ahead of the competition.
In this guide, you'll discover everything you need to know about basket analysis: the fundamentals, step-by-step process, powerful algorithms, real-world use cases, and the latest tools and trends for 2025. Ready to turn data into action and outpace your competitors? Dive in and start mastering basket analysis today.
Understanding Basket Analysis: Fundamentals and Key Concepts
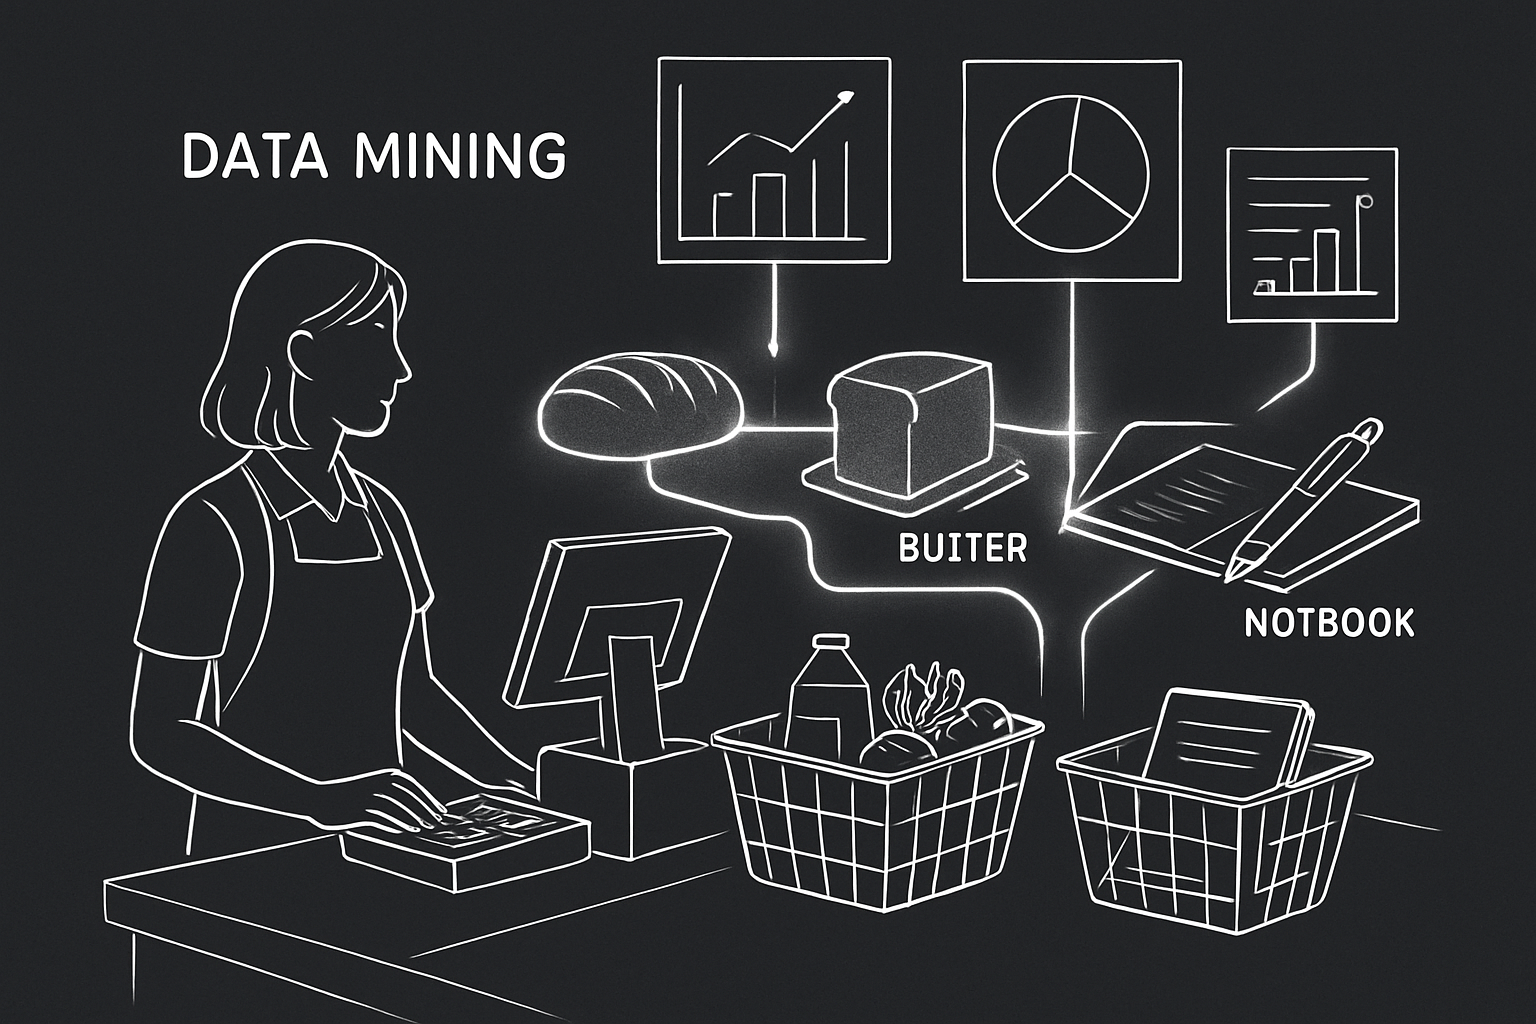
Basket analysis is a cornerstone of retail analytics, unlocking the patterns behind what customers purchase together. At its core, basket analysis (also known as market basket analysis) is a data mining technique that uncovers associations between products within transactions. This method has evolved from simple manual observations in brick-and-mortar stores to advanced, algorithm-driven insights in today’s omnichannel retail landscape.
The foundation of basket analysis lies in association rules, which reveal how the purchase of one product (the antecedent) increases the likelihood of another product being bought (the consequent). For example, if a shopper buys bread, they might also buy butter. This classic pairing illustrates how retailers can use these insights to drive cross-selling and boost revenue.
Basket analysis is essential for predicting future customer behavior. By understanding which products frequently appear together in baskets, businesses can design promotions, rearrange store layouts, and tailor recommendations to maximize sales. For a deeper dive into the fundamentals and strategies behind this technique, check out this Market Basket Analysis: A Comprehensive Guide.
What is Basket Analysis?
Basket analysis systematically examines transaction data to reveal hidden relationships between products. Traditionally, retailers would observe trends through sales reports, but today’s digital systems record every transaction, enabling much deeper analysis.
The main idea is to identify “if-then” relationships, such as: “If a customer buys bread, then they are likely to buy butter.” These associations help businesses understand which items drive additional sales and can inform everything from inventory planning to targeted promotions.
This technique is now used across e-commerce and physical retail, helping companies anticipate consumer needs and create personalized shopping experiences. Thanks to scalable algorithms and cloud computing, basket analysis is more accessible and actionable than ever before.
Core Metrics: Support, Confidence, and Lift
To make sense of basket analysis results, three core metrics are used: support, confidence, and lift. These metrics quantify the strength and significance of product associations.
- Support measures how often a product combination appears in all transactions. For example, if pens and notebooks are bought together in 1,000 out of 5,000 transactions, the support is 20%.
- Confidence assesses the likelihood of buying item B when item A is purchased. If 700 out of 1,000 bread buyers also buy butter, confidence is 70%.
- Lift evaluates how much more likely two items are bought together compared to being bought independently. A lift greater than 1 indicates a strong association.
Here’s a quick summary:
| Metric | Formula | Example Value |
|---|---|---|
| Support | Transactions with A & B / Total | 1,000 / 5,000 = 20% |
| Confidence | Transactions with A & B / A only | 700 / 1,000 = 70% |
| Lift | Confidence / (Support of B) | 0.7 / 0.14 = 5 |
Understanding these metrics is crucial for turning raw data into actionable insights.
Types of Basket Analysis
There are several types of basket analysis, each serving different business objectives.
- Descriptive analysis identifies common product combinations, providing a snapshot of current customer behavior.
- Predictive analysis uses machine learning to forecast future purchasing patterns, enabling proactive marketing and inventory decisions.
- Differential analysis compares shopping baskets across customer segments or time periods to highlight emerging trends or seasonal changes.
For example, a retailer might use differential analysis to compare holiday versus non-holiday shopping baskets. This can reveal which products to bundle during peak seasons or which items to promote to specific demographics.
By leveraging these types, businesses can refine their strategies and remain agile in a changing market.
Association Rule Mining
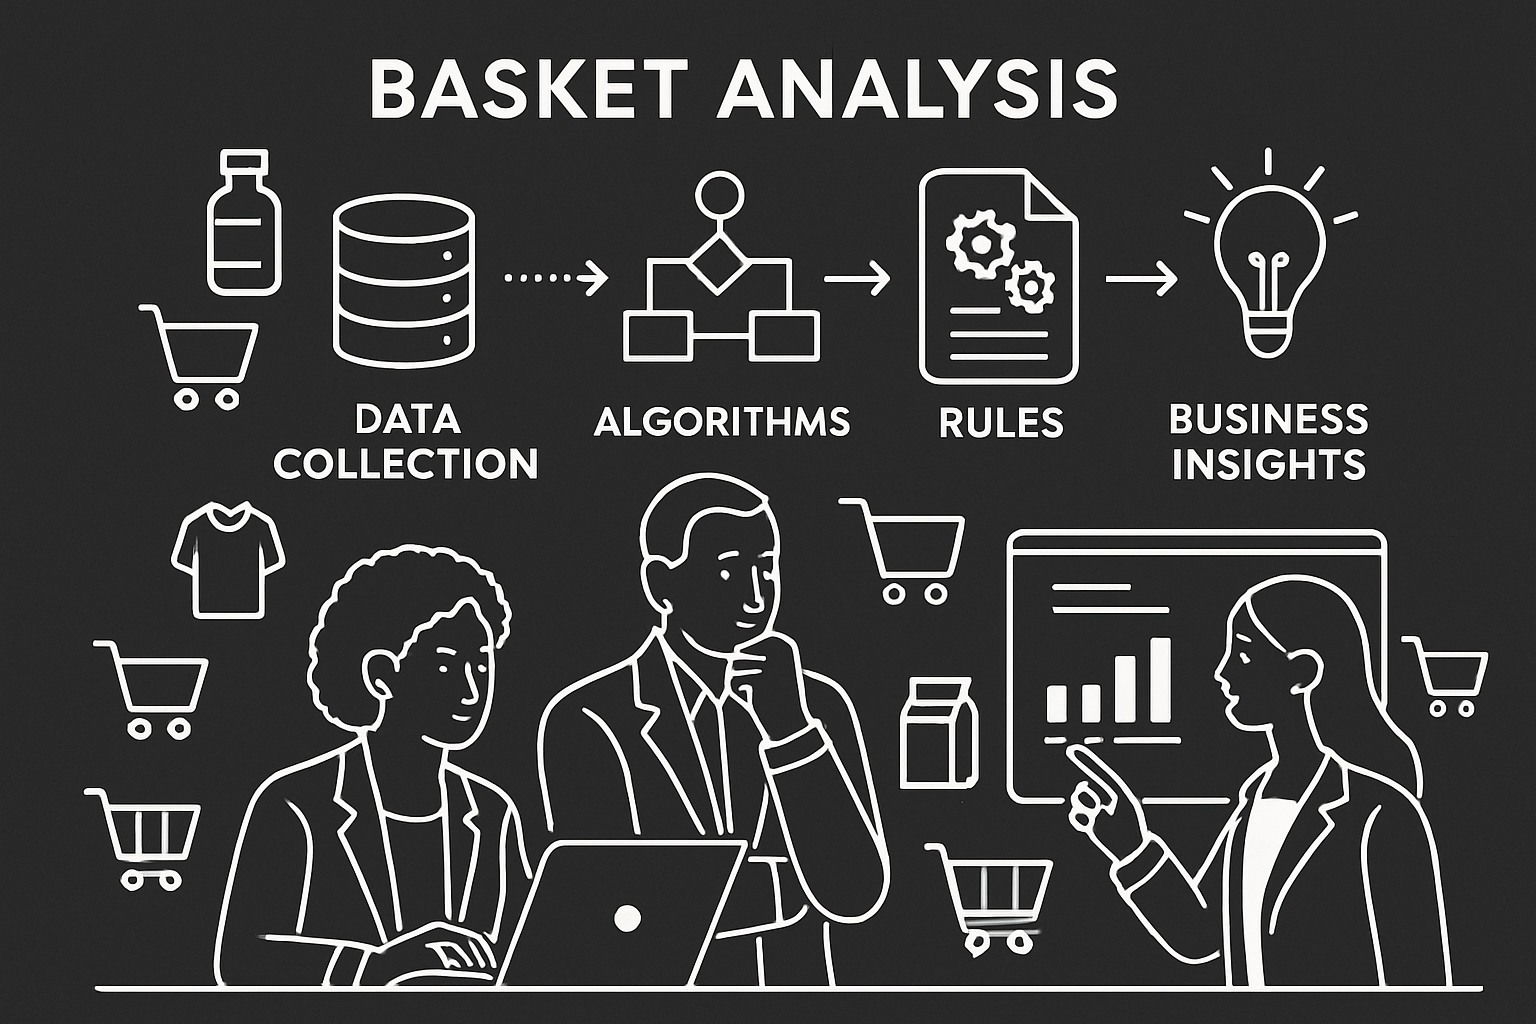
Association rule mining is the backbone of basket analysis. It involves two main steps: finding frequent itemsets (combinations of products that appear together often) and generating strong association rules based on predefined support and confidence thresholds.
The process typically starts by scanning transaction data to identify frequent itemsets. Algorithms like Apriori or FP-Growth are often used to streamline this search. Once frequent itemsets are found, rules are generated—for example, “If milk, then bread”—and evaluated for business relevance.
This systematic approach enables retailers to sift through large datasets and extract actionable rules. The result? Data-driven decisions that enhance product placement, marketing, and customer experience.
Step-by-Step Process: How Basket Analysis Works in 2025
Understanding how to implement basket analysis in 2025 means following a clear, structured process. Each stage builds on the previous one, transforming raw sales data into actionable insights that can transform business outcomes. Let’s break down each step.
Data Collection and Preparation
The first step in basket analysis is gathering high-quality transaction data. This includes records of what each customer purchased, product details, timestamps, and customer segments. Clean data is essential—remove duplicates, correct errors, and fill in missing values.
For example, preparing e-commerce logs might involve running code like:
import pandas as pd
df = pd.read_csv('transactions.csv')
df.dropna(inplace=True)
df = df[df['product_id'].notnull()]
Standardizing formats ensures the data is ready for analysis. Well-prepared data forms the backbone of effective basket analysis, allowing for accurate identification of purchase patterns.
Identifying Frequent Itemsets
With clean data in hand, the next step is to find frequent itemsets—groups of products often bought together. Algorithms like Apriori and FP-Growth scan transactions to spot these patterns.
Set a minimum support threshold to filter out rare combinations. For instance, in a grocery dataset, you might discover that bread and butter appear together in 15% of transactions. This step is critical, as it highlights the strongest product pairings for further exploration.
To explore more advanced techniques, check out Advanced market basket analysis strategies.
Generating and Evaluating Association Rules
Once frequent itemsets are identified, generate association rules in the form “If A, then B.” Calculate support, confidence, and lift for each rule. These metrics help determine which rules are both statistically significant and useful for business goals.
For example, a rule like “If milk, then bread” could have:
- Support: 12%
- Confidence: 60%
- Lift: 1.5
Filter out rules that don’t meet your desired thresholds. Focusing on high-confidence, high-lift rules ensures your basket analysis delivers actionable recommendations.
Interpreting Results and Extracting Insights
After generating rules, it’s time to turn numbers into strategy. Visualize the results with charts or heatmaps to spot trends quickly. For example, a heatmap might reveal that snacks and drinks are commonly bought together during weekends.
Interpret the findings in context. Does a particular product pairing suggest a new bundling opportunity? Are there seasonal trends you can capitalize on? The power of basket analysis lies in connecting data patterns to real business actions.
Applying Insights to Business Strategies
Finally, use the insights from basket analysis to drive results. Optimize inventory by stocking commonly paired items together. Design marketing campaigns that promote product bundles based on frequent itemsets.
For instance, if analysis shows that customers often buy pens and notebooks together, launch a “Back to School” bundle or offer discounts for buying both. These targeted strategies not only increase sales but also enhance the customer experience.
Key Algorithms and Tools for Basket Analysis
Unlocking the full potential of basket analysis depends on the algorithms and tools you use. In 2025, a mix of classic and cutting-edge approaches empowers businesses of any size to turn raw transaction data into actionable insights.
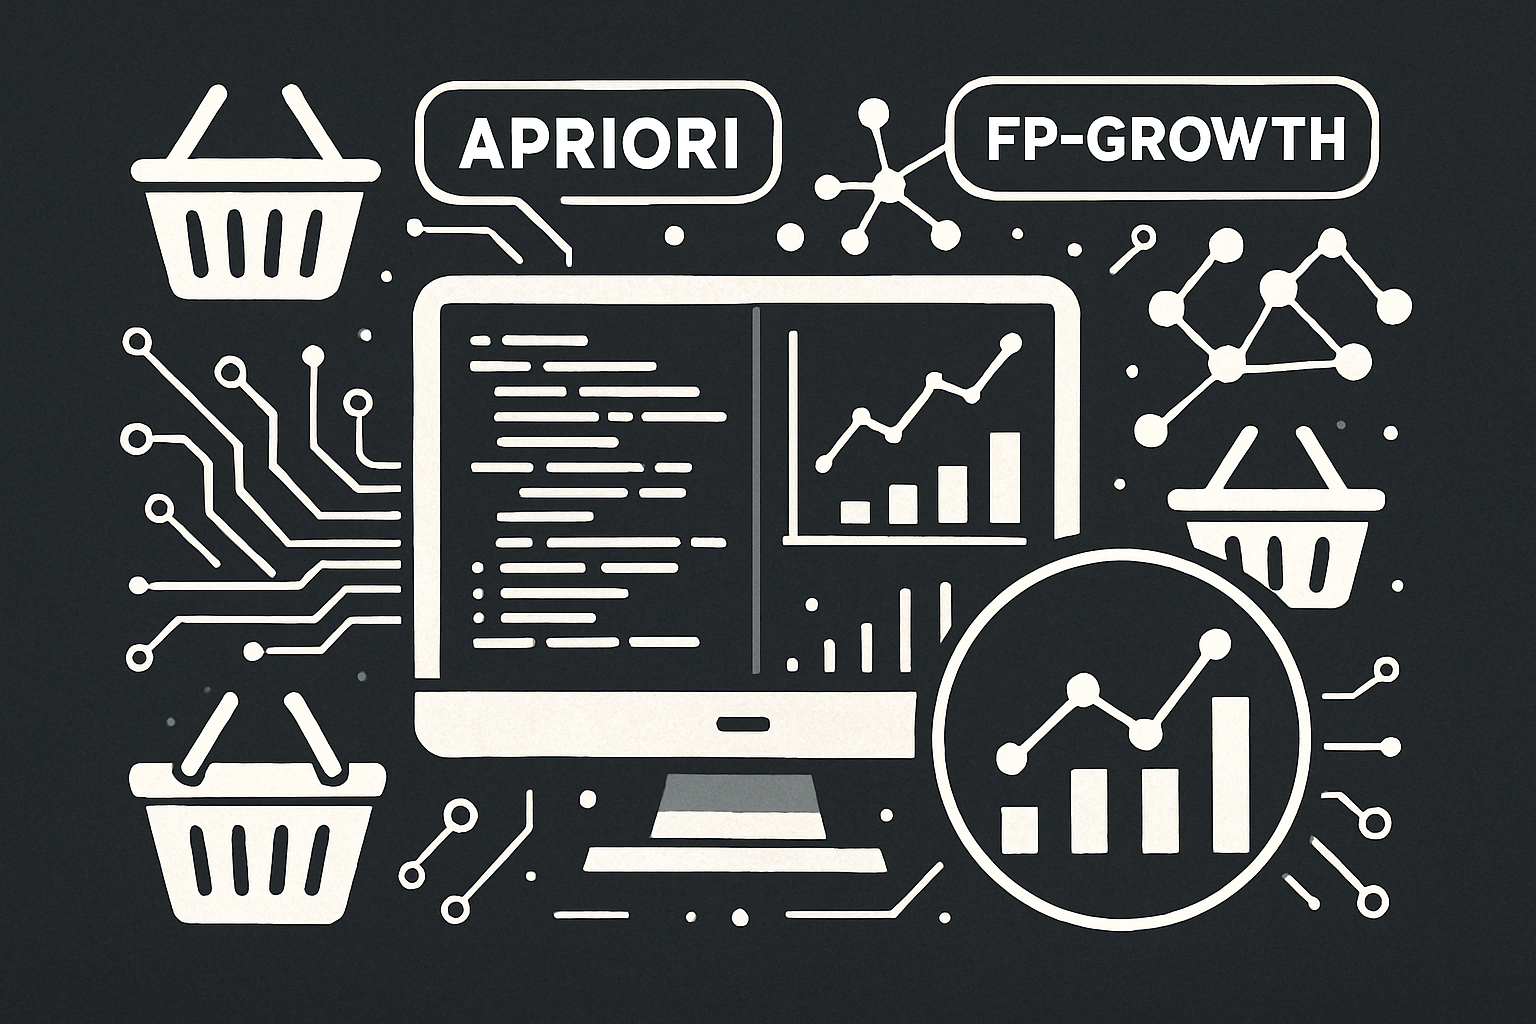
Apriori Algorithm
The Apriori algorithm is foundational for basket analysis, using a systematic, iterative approach to identify frequent itemsets in transaction data. It works by scanning the dataset multiple times, each time looking for product combinations that meet a minimum support threshold.
Apriori’s greatest strength is its simplicity and interpretability. You can easily trace which product pairs or groups drive your rules. However, it can become slow with large datasets, as the number of possible combinations grows rapidly.
For example, in Python, the mlxtend library lets you run Apriori on supermarket sales data, quickly surfacing which items drive the most frequent cross-sales. With basket analysis powered by Apriori, even small retailers can start finding hidden product affinities.
FP-Growth Algorithm
FP-Growth, or Frequent Pattern Growth, is a faster, more scalable alternative to Apriori for basket analysis. Instead of generating all possible combinations, FP-Growth builds a compact tree structure (the FP-tree) to directly extract frequent itemsets from large datasets.
This approach drastically reduces computation time, making it ideal for e-commerce platforms with millions of transactions. FP-Growth is especially useful when you need to analyze large-scale shopping data without sacrificing speed.
A real-world case study: many online retailers use FP-Growth for real-time recommendation engines. By integrating this algorithm, basket analysis can deliver instant “Frequently Bought Together” suggestions at checkout, boosting conversion rates.
Other Notable Algorithms (AIS, SETM)
Beyond Apriori and FP-Growth, other algorithms like AIS and SETM have carved their niche in basket analysis. AIS is designed to work efficiently with large, dynamic transaction sets, while SETM excels at handling complex item relationships.
Choosing between these depends on your dataset’s size and the complexity of your product catalog. For high-volume online retail, SETM’s speed can be a game-changer. To explore advanced rule-based techniques, the research paper Market Basket Analysis Using Rule-Based Algorithms and Data Mining Techniques provides deeper technical insights and comparisons.
Experimenting with multiple algorithms ensures your basket analysis is both robust and tailored to your business needs.
Modern Tools and Platforms
Today’s basket analysis is powered by a range of user-friendly tools. Python offers libraries like mlxtend and efficient-apriori that let analysts run association rule mining with just a few lines of code. For R users, packages like arules are equally popular.
Cloud-based analytics platforms have made basket analysis accessible to non-technical teams. Many integrate directly with business intelligence dashboards, allowing you to visualize patterns and rules in real time.
For example, you can use Python’s mlxtend to conduct a full basket analysis—importing transaction data, mining rules, and exporting actionable insights, all from a single workflow.
Choosing the Right Approach for Your Business
Selecting the best approach to basket analysis depends on several factors: dataset size, technical resources, and business goals. Smaller retailers might prioritize simplicity and ease of use, while large e-commerce platforms need algorithms that scale with millions of records.
Consider the trade-offs between accuracy, speed, and interpretability. For some, a quick, high-level overview is enough. For others, detailed, granular rules offer the most value.
For instance, a small boutique could thrive using a simple Apriori workflow, while a global retailer might opt for FP-Growth or cloud-based solutions to power real-time recommendations. The right tools make basket analysis a strategic asset, no matter your scale.
Real-World Applications and Industry Use Cases
Basket analysis is transforming how businesses in every industry understand and serve their customers. Its power lies in uncovering product affinities, driving sales, and shaping smarter business decisions. Let’s explore how basket analysis is applied across key sectors, with real examples illustrating its impact in 2025.
Retail and E-commerce
In retail and e-commerce, basket analysis is the secret behind those “Frequently Bought Together” suggestions and optimized store layouts. By analyzing transaction data, retailers identify popular product pairings, leading to more effective cross-selling and upselling.
For example, Amazon’s recommendation engine leverages basket analysis to suggest complementary items, boosting average order value. Physical stores use these insights to group products on shelves, increasing the likelihood of impulse buys. According to industry reports, retailers who adopt basket analysis can see up to a 20% increase in cross-sell conversions.
If you’re looking to dive deeper, check out Market basket analysis for ecommerce growth for insights on driving revenue in the digital marketplace.
Hospitality and Food Service
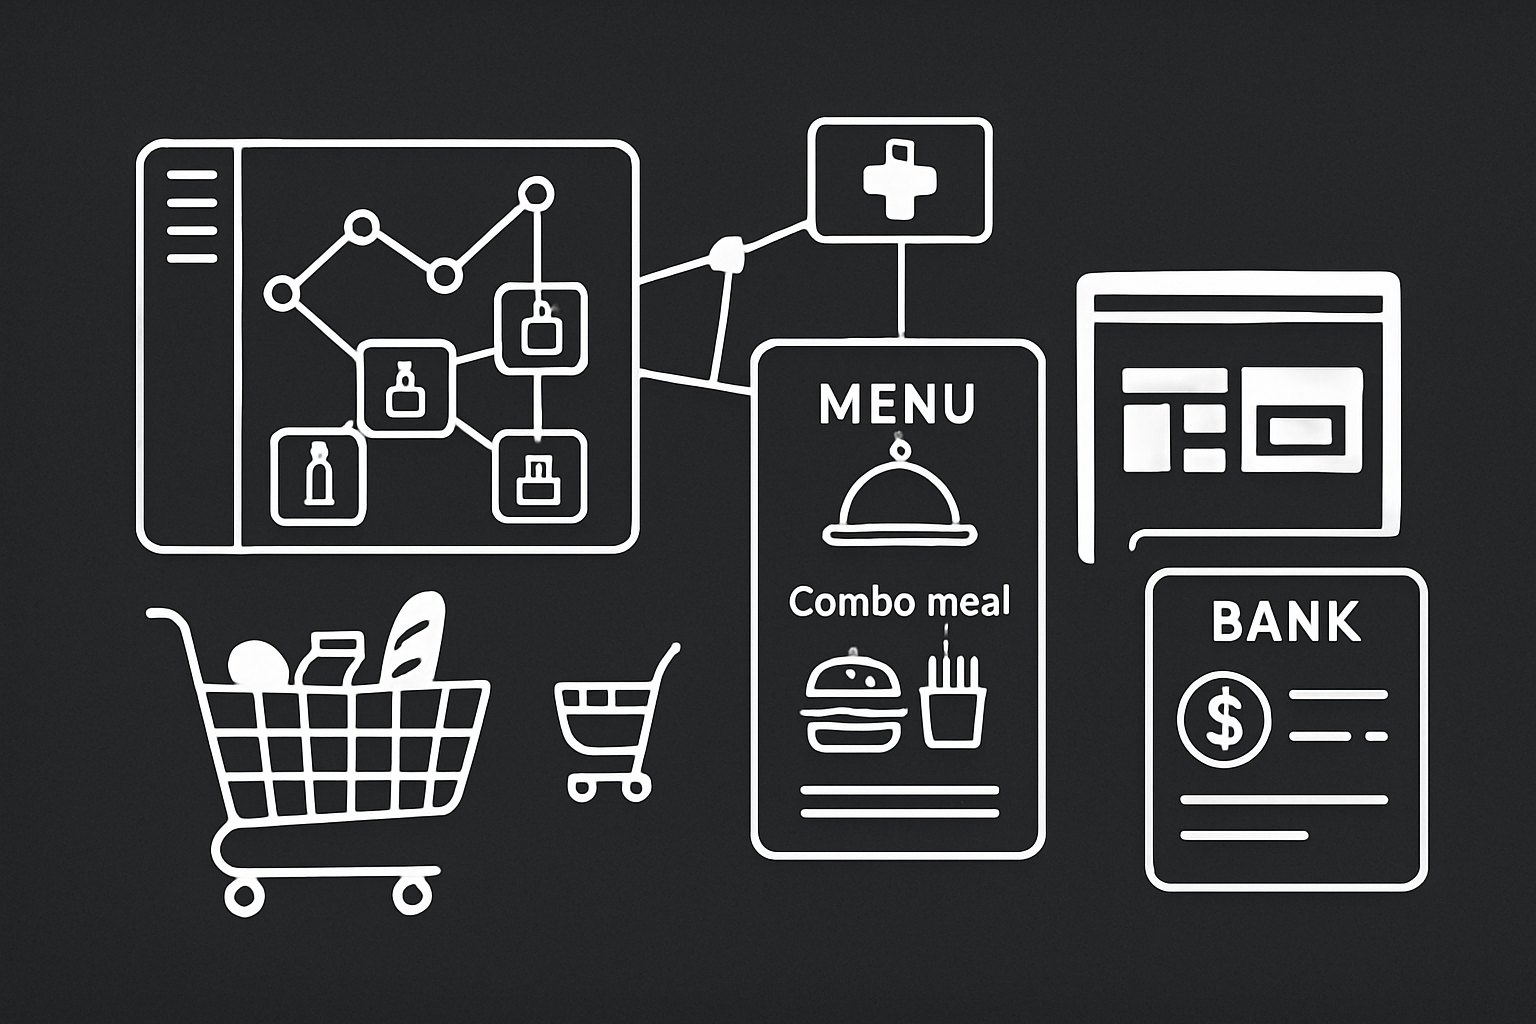
Restaurants and food service operators use basket analysis to craft irresistible meal bundles and combos. By studying which dishes are commonly ordered together, they design menu pairings that drive higher spend per customer.
For instance, a fast-food chain may discover that customers who order burgers also frequently add fries and a drink. Armed with this data, they create bundled “meal deals” that are both appealing and profitable. Upselling becomes easier when servers suggest popular add-ons, tailored by basket analysis.
Healthcare and Pharmaceuticals
In healthcare, basket analysis improves both patient care and operational efficiency. Hospitals and pharmacies use it to identify co-prescribed medications, ensuring inventory is stocked for common combinations.
For example, analyzing prescription data might reveal that patients taking a certain blood pressure medication often require a specific cholesterol drug. This helps healthcare providers bundle treatments and avoid stockouts. Basket analysis is also instrumental in detecting unusual prescription patterns that could indicate fraud or error, supporting safer practices.
Banking, Finance, and Telecommunications
Financial institutions and telecom providers harness basket analysis to tailor their product offerings. By examining which services customers purchase together, banks can design compelling product bundles, such as pairing a new savings account with a credit card.
Telecom companies analyze the data to create bundled packages—think mobile plans combined with streaming services. For example, basket analysis may reveal that customers who upgrade their phone plan are likely to add international calling options, prompting targeted promotions.
Manufacturing and Supply Chain
Manufacturers and supply chain managers use basket analysis to optimize production and inventory. By analyzing which products are commonly ordered together, they can streamline manufacturing schedules and reduce inefficiencies.
Imagine a manufacturer discovering that orders for safety gloves often coincide with orders for protective eyewear. They can adjust procurement and production to meet this joint demand, minimizing stockouts and excess inventory. This predictive power makes basket analysis a cornerstone for efficient supply chains.
Emerging Sectors and Trends
Beyond traditional industries, basket analysis is gaining ground in sectors like entertainment, travel, and subscription services. Streaming platforms, for instance, use it to recommend content bundles based on users’ viewing histories.
Travel agencies leverage basket analysis to offer curated vacation packages, combining flights, hotels, and experiences that align with customer preferences. The technique is also fueling innovation in digital subscriptions and personalized experiences.
To explore more innovative uses, see Market basket analysis beyond the cart, which highlights how this approach is reshaping new markets.
Industry Comparison Table: Basket Analysis Benefits
| Industry | Main Benefit | Example Application |
|---|---|---|
| Retail/E-commerce | Boost cross-sell & AOV | Product recommendations |
| Hospitality/Food Service | Optimize menu combos | Meal deal design |
| Healthcare/Pharma | Improve care & safety | Co-prescription analysis |
| Banking/Telecom | Drive bundled sales | Financial product packages |
| Manufacturing/Supply Chain | Streamline production & inventory | Predictive order management |
| Emerging Sectors | Personalize experiences | Content/vacation bundle suggestions |
Basket analysis continues to unlock new opportunities, helping businesses adapt and thrive in an ever-evolving marketplace.
Future Trends and Innovations in Basket Analysis for 2025
In 2025, basket analysis is poised for a major transformation as technology, data, and customer expectations evolve. Retailers and e-commerce businesses are racing to unlock new insights, boost revenue, and stay ahead of the curve. Let’s explore the most impactful trends shaping the future of basket analysis.
AI and Machine Learning Advancements
Artificial intelligence is revolutionizing how basket analysis uncovers complex purchase patterns. Deep learning models can now detect subtle associations across vast data sets, going far beyond traditional rule-based methods. Real-time analysis enables instant recommendations at checkout, personalizing offers on the fly.
Retailers are embracing AI-powered tools that adapt to changing customer behavior, leading to smarter product bundles and promotions. For an in-depth look at these innovations, check out AI-Enhanced Market Basket Analysis for Retail, which highlights advanced applications and success stories.
Personalization and Hyper-Targeted Marketing
With more data and smarter algorithms, basket analysis is fueling a new era of hyper-personalization. Businesses can craft individualized promotions and dynamic product bundles tailored to each shopper’s unique preferences and real-time basket contents.
Imagine sending a custom offer right after checkout or delivering a dynamic discount as a customer adds items to their cart. These strategies help increase order values and deepen customer loyalty. Discover how to put these tactics into practice in the post Increase average order value with basket analysis.
Omnichannel Data Integration
Today’s shoppers move fluidly between in-store, online, and mobile channels. Integrating transaction data from every touchpoint is a top priority for effective basket analysis. Unified profiles allow retailers to identify cross-channel buying patterns and deliver consistent recommendations everywhere.
However, merging data from different sources isn’t easy. Businesses are investing in robust data pipelines and analytics platforms to overcome challenges like inconsistent formats and privacy requirements. Success here means a truly seamless customer experience powered by holistic insights.
Privacy, Ethics, and Data Security
As basket analysis becomes more powerful, consumer concerns about data privacy and transparency are growing. Regulations such as GDPR and CCPA are pushing businesses to anonymize transaction data and obtain clear consent for analytics projects.
Ethical considerations also come into play, especially when analyzing sensitive categories or targeting vulnerable groups. Forward-thinking companies are prioritizing secure data handling and open communication about how customer data is used, building trust as a competitive advantage.
Automation and User-Friendly Tools
The rise of no-code and low-code platforms is democratizing access to basket analysis. Small businesses, once limited by technical barriers, can now harness advanced analytics without hiring a data science team.
Plug-and-play tools with intuitive dashboards are making it easy to generate actionable insights, visualize patterns, and export recommendations. This trend is leveling the playing field, empowering more retailers to compete with industry giants.
Preparing for the Next Wave
The future of basket analysis will be shaped by adaptive, continuously learning models that respond to shifts in customer behavior and market trends. Businesses are increasingly investing in advanced analytics, recognizing the need for agility and innovation.
Keeping pace means embracing automation, staying compliant with regulations, and fostering a culture of experimentation. With 75% of businesses planning to invest in analytics by 2025, the next wave of basket analysis promises even greater impact and opportunity.