In 2025, the e-commerce landscape is more competitive than ever. Brands that thrive are those that make every decision count. Relying on intuition alone is a risk that few can afford.
This guide is your essential roadmap to mastering the e commerce analysis report. You will learn how to gather, analyze, and act on critical data to stay ahead.
Discover which metrics matter most, the top tools for insight, and proven strategies for boosting ROI. Take control of your growth with a clear, actionable process for data-driven success.
Understanding E-Commerce Analysis Reports
In the fast-paced world of online retail, the e commerce analysis report has become a cornerstone for strategic decision-making. These reports distill vast amounts of data into actionable insights, guiding businesses through complex market dynamics. By systematically evaluating performance, customer behavior, and operational efficiency, an e commerce analysis report empowers leaders to make informed choices and adapt to emerging trends.
What is an E-Commerce Analysis Report?
An e commerce analysis report is a structured document that captures, organizes, and interprets key data points from online business operations. Its primary purpose is to offer a clear view of what is driving sales, customer engagement, and profitability. These reports support strategic business decisions by highlighting patterns and trends. There are various types of analytics within these reports: descriptive (what happened), diagnostic (why it happened), predictive (what will happen), and prescriptive (what should be done next). For instance, a monthly sales performance report tracks revenue shifts, while a customer behavior analysis explores purchase journeys and conversion triggers.
Key Metrics Tracked in 2025
A robust e commerce analysis report for 2025 tracks a blend of traditional and emerging metrics. Core KPIs include revenue, conversion rate, average order value (AOV), and customer lifetime value (CLV). Businesses also monitor cart abandonment rates, traffic sources, and device segmentation to refine marketing efforts. Product performance analytics and inventory turnover rates help optimize stock levels. Newer KPIs, such as personalization impact, omnichannel engagement, and AI-driven metrics, reflect the evolving landscape. For a deeper dive into the most important analytics terms and benchmarks, see this Key e-commerce metrics and KPIs resource.
Why Analysis Reports Matter for 2025 Success
In 2025, consumer preferences shift rapidly, making real-time data analysis essential for survival and growth. An e commerce analysis report provides the agility to adapt to market changes and outpace competitors. Real-time insights give brands a competitive edge, helping them pivot quickly in response to customer demands. According to the Shopify Plus 2023 report, 74% of high-growth e-commerce brands rely on advanced analytics. As an example, brands leveraging analysis have increased average order value by 20% through targeted cross-selling and upselling strategies.
Common Challenges in E-Commerce Reporting
Despite their benefits, e commerce analysis report creation faces common hurdles. Data silos across platforms can make integration difficult, leading to incomplete information. Inaccurate or inconsistent data collection can distort insights, while tracking excessive or irrelevant metrics causes confusion. Many businesses also struggle with multi-channel attribution, making it hard to understand which campaigns truly drive sales. Overcoming these challenges requires strategic data management and a focus on meaningful KPIs.
The Evolution of E-Commerce Reporting Tools
Reporting tools have evolved from manual spreadsheets to advanced, automated dashboards powered by artificial intelligence. Modern solutions integrate seamlessly with platforms like Shopify and WooCommerce, and offer customizable, real-time analytics. These advancements enable businesses to track performance efficiently and scale their reporting as they grow.
Step-by-Step Guide to Creating an E-Commerce Analysis Report
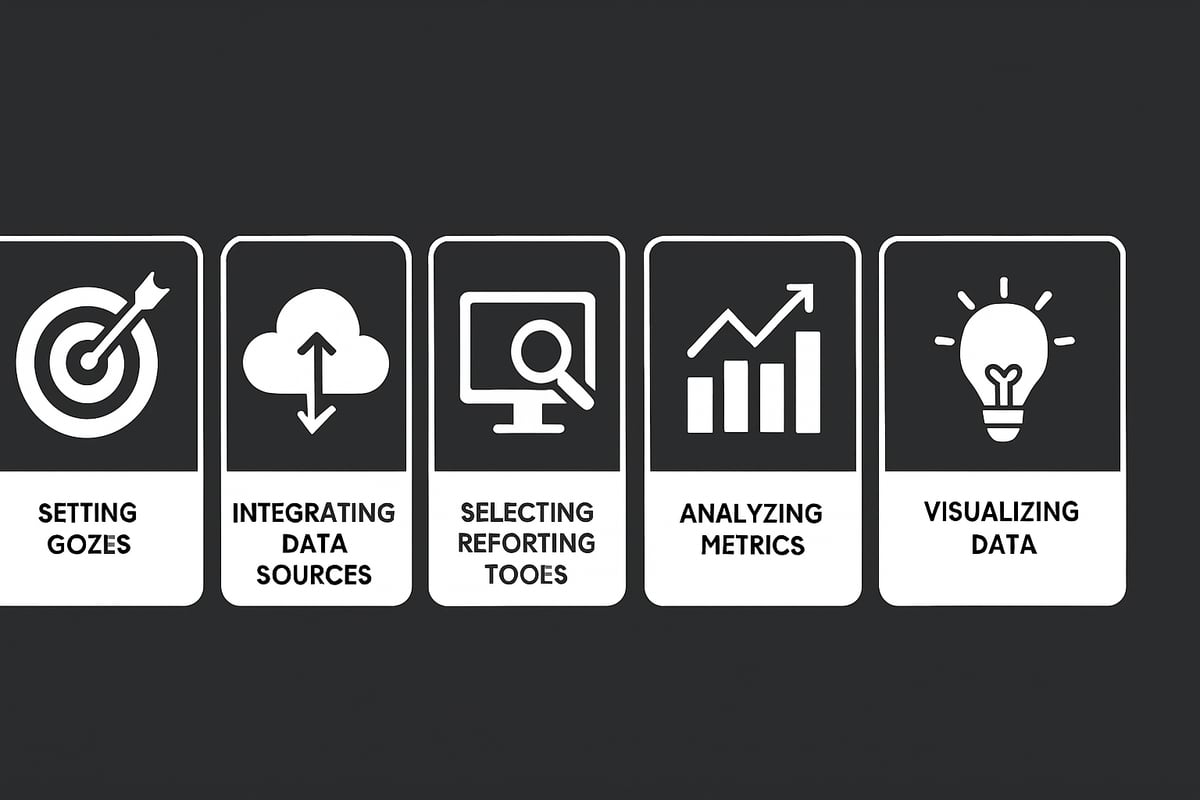
Building an effective e commerce analysis report requires a structured approach. By following these six steps, you can transform raw data into actionable business strategies. Let’s break down each stage for clarity and impact.
Step 1: Define Your Business Goals and KPIs
The first step in any e commerce analysis report is to clarify your business objectives. Are you aiming for growth, retention, or profitability? Align your reporting focus with these goals to ensure relevance.
Next, select KPIs that reflect both your strategy and current market trends. For example, a subscription-based store may prioritize customer retention KPIs, while a new brand might focus on acquisition and conversion rates.
Common KPIs include:
- Customer Lifetime Value (CLV)
- Average Order Value (AOV)
- Conversion Rate
- Churn Rate
By starting with clear objectives, your e commerce analysis report will provide actionable insights rather than overwhelming data.
Step 2: Collect and Integrate Data
The foundation of a reliable e commerce analysis report is comprehensive data collection. Gather information from your website, CRM, marketplaces, advertising platforms, and social media channels.
Ensure your datasets are clean and unified. Disconnected or duplicate data can lead to misleading conclusions. Use integration tools such as Google Analytics 4, Shopify Analytics, or third-party connectors to streamline this process.
For a comprehensive overview of effective data collection and integration methods, refer to this Guide to e-commerce data analysis.
A well-integrated data pipeline supports accurate reporting and enables deeper analysis.
Step 3: Choose the Right Reporting Tools
Selecting the right tools is crucial for creating an efficient e commerce analysis report. Look for solutions that offer automation, robust visualization, customizability, and scalability.
Popular platforms include:
| Tool | Strengths | Integration |
|---|---|---|
| Google Data Studio | Free, customizable dashboards | Broad compatibility |
| Tableau | Advanced analytics, scalability | Enterprise ready |
| Looker | Data modeling, collaboration | Cloud-based |
| Shopify Analytics | E-commerce focus, ease of use | Shopify stores |
Make sure your chosen tool aligns with your business size and tech stack. User-friendliness is essential, as is the ability to adapt as your business evolves.
Step 4: Analyze Key Metrics and Trends
With your data integrated and tools in place, it’s time to analyze. Segment your data by channel, device, geography, and customer cohort. This helps identify patterns and opportunities.
Focus on metrics that matter most:
- Top-performing products and categories
- Seasonality and emerging trends
- Campaign performance by channel
A thorough e commerce analysis report reveals which initiatives drive growth and where optimizations are needed. Spotting trends early allows you to pivot strategies with agility.
Step 5: Visualize and Interpret the Data
Effective visualization turns complex numbers into clear stories. Use dashboards, charts, and heatmaps to highlight key findings in your e commerce analysis report.
For example, a heatmap can pinpoint where users abandon the checkout process, guiding UX improvements. Storytelling with data ensures stakeholders understand not just what happened, but why.
Best practices include:
- Highlighting anomalies or spikes
- Comparing cohorts over time
- Using color and layout for clarity
The right visuals make your report actionable and memorable.
Step 6: Generate Actionable Insights and Recommendations
The final step is to translate your findings into concrete actions. Review your e commerce analysis report to identify areas with the highest ROI potential.
Prioritize recommendations based on business impact and resource availability. For instance, if data shows certain products are often purchased together, consider launching targeted cross-sell offers.
Actionable examples:
- Bundle slow-moving items with bestsellers
- Adjust marketing spend to high-performing channels
- Refine the user journey to reduce churn
By closing the loop from analysis to action, your e commerce analysis report becomes a catalyst for ongoing improvement.
Essential Metrics and KPIs for 2025 E-Commerce Analysis
To achieve sustainable growth in 2025, every e commerce analysis report must be anchored in the right metrics and KPIs. Tracking the right data translates insights into action, helping you respond to new trends and outperform competitors.
Revenue and Conversion Metrics
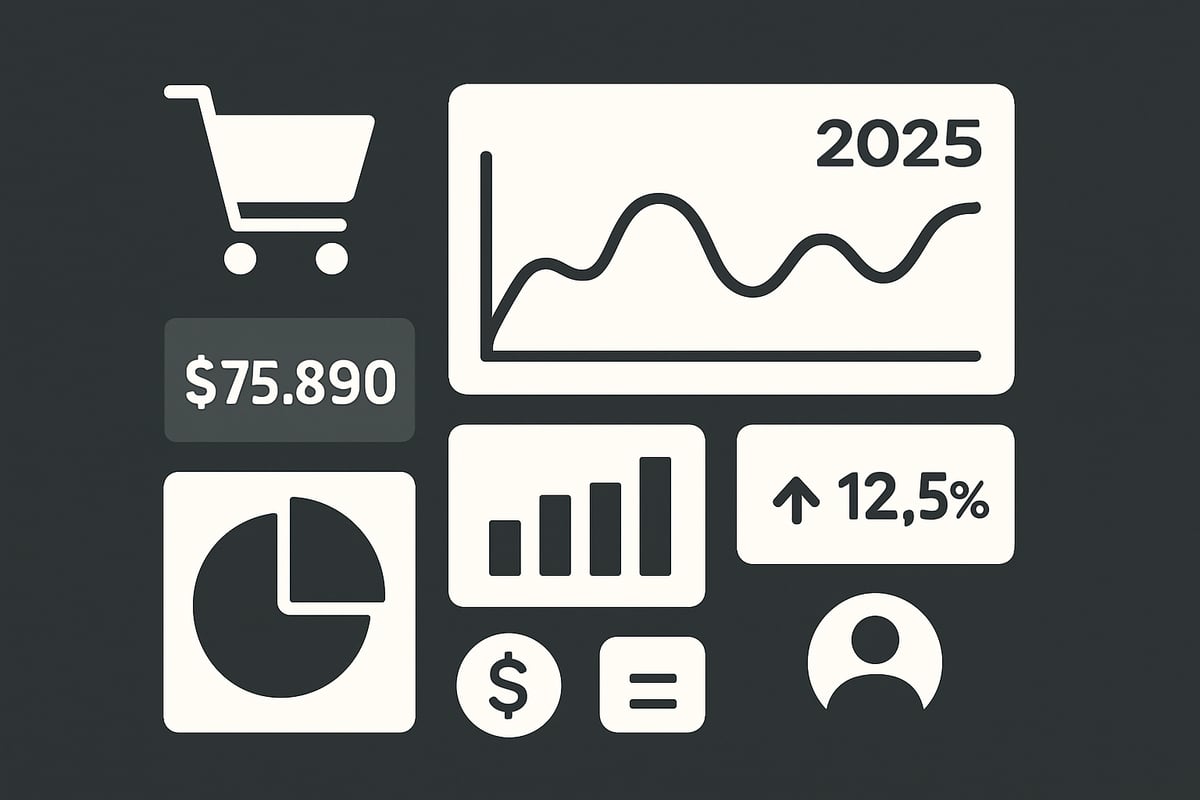
Revenue and conversion metrics are the backbone of any e commerce analysis report. Total revenue, gross profit, and net profit offer a clear snapshot of financial health. Tracking conversion rates by channel, device, and campaign reveals where your sales funnel is strongest and where optimizations are needed.
For example, focusing on mobile conversion rate optimization can yield significant gains as mobile traffic continues to dominate. A detailed sales analysis in e-commerce helps pinpoint which products drive the most value and where opportunities for growth exist.
- Total revenue
- Gross profit and net profit
- Conversion rates by channel, device, and campaign
Customer Behavior and Retention Metrics
Understanding customer behavior is vital for any e commerce analysis report. Repeat purchase rate, customer lifetime value (CLV), and churn rate highlight how well you are retaining customers. Segmenting users and conducting cohort analysis allows you to identify high-value groups and tailor retention strategies.
Retaining just 5% more customers can increase profits by up to 95%, according to Bain & Co. These metrics empower brands to build loyalty and maximize return from every customer relationship.
- Repeat purchase rate
- CLV and churn rate
- Customer segmentation and cohort analysis
Product and Inventory Performance
A comprehensive e commerce analysis report evaluates product and inventory performance. Identifying bestsellers, slow movers, and dead stock helps optimize inventory management. Inventory turnover rate and stockout frequency ensure you are meeting demand without overstocking.
ABC analysis is a practical method for prioritizing inventory based on value and sales velocity. This approach enables data-driven decisions that reduce costs and improve cash flow.
- Bestsellers and slow movers
- Inventory turnover rate
- Stockout frequency and ABC analysis
Marketing and Traffic Metrics
Marketing and traffic metrics are essential for a robust e commerce analysis report. Source and medium breakdowns, return on ad spend (ROAS), cost per acquisition (CPA), and customer acquisition cost (CAC) reveal the effectiveness of marketing investments.
Multi-channel attribution and assisted conversions help you understand which touchpoints drive conversions. Nearly half of all e-commerce traffic, 49%, comes from organic search as reported by Statista in 2023.
- Source/medium breakdown
- ROAS, CPA, and CAC
- Multi-channel attribution
Emerging Metrics for 2025
As e commerce analysis report strategies evolve, new metrics are gaining importance. AI-driven personalization impact measures how tailored experiences boost engagement. Social commerce engagement and video shopping metrics offer insights into the effectiveness of emerging sales channels.
Tracking these KPIs ensures your reporting adapts to the latest industry trends and customer expectations.
- AI-driven personalization impact
- Social commerce engagement
- Video shopping metrics
Advanced Analysis Techniques and Tools for E-Commerce Success
Staying competitive in 2025 requires mastery of advanced tools and techniques within your e commerce analysis report. Leveraging AI, automation, and data science not only uncovers new growth opportunities but also ensures your business adapts rapidly to market shifts.
Predictive Analytics and AI in E-Commerce Reporting
Predictive analytics has transformed the e commerce analysis report into a powerful decision-making asset. By harnessing machine learning, businesses can forecast sales, anticipate demand, and personalize customer experiences with precision.
AI-driven recommendation engines analyze customer behavior, predicting which segments are likely to convert or churn. This enables targeted retention campaigns and smarter inventory planning. For an in-depth look at how AI personalization is revolutionizing e-commerce, see AI-Powered Personalization Enhancing Customer Experience.
Using these techniques, your reports become proactive tools for growth, not just passive records.
Market Basket Analysis for Product Pairing and Cross-Sell Optimization
Market basket analysis is essential for any modern e commerce analysis report. This technique uncovers product affinities by analyzing what customers purchase together, revealing valuable cross-sell and upsell opportunities.
For example, identifying that customers who buy running shoes also frequently purchase athletic socks allows you to create bundled offers. This not only increases average order value but also enhances customer satisfaction.
To implement market basket analysis, use your reporting tool’s association rules or integrate specialized AI modules. These insights directly impact merchandising and campaign strategies.
How ApusNest Empowers E-Commerce Analysis
ApusNest takes your e commerce analysis report to the next level with AI-powered market basket analysis and actionable reporting. The platform integrates seamlessly with Shopify, WooCommerce, and CSV data sources, making adoption simple.
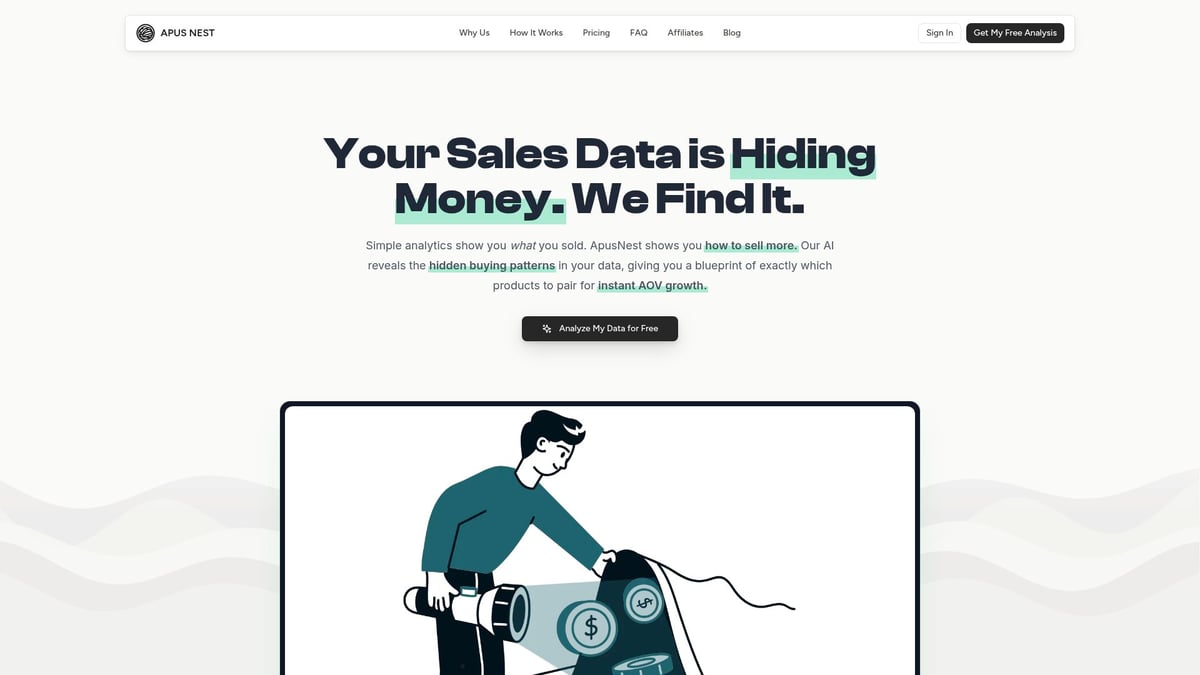
With user-friendly dashboards and instant recommendations, ApusNest helps merchants identify high-impact cross-sell and upsell opportunities. Real-time insights empower you to optimize store layout and product placement.
Merchants using ApusNest have reported significant increases in average order value and more efficient store operations, all driven by data-backed recommendations.
Real-Time and Automated Reporting Solutions
A modern e commerce analysis report must deliver real-time insights for agile decision-making. Automated dashboards track KPIs continuously, alerting you to sudden changes in performance, such as a drop in conversion rates or a spike in cart abandonment.
Setting up automated alerts ensures your team can react instantly to both opportunities and issues. This agility is vital for staying ahead in a fast-paced e-commerce environment.
With real-time reporting, your data becomes a living asset, always up to date and ready to inform strategic moves.
Customization and Scalability of Reporting Tools
No e commerce analysis report is one-size-fits-all. Customization allows you to tailor metrics and visualizations to your unique business model, whether you run a single storefront or manage multiple brands globally.
Scalable tools ensure your reporting infrastructure grows with your business. Features like multi-store dashboards, role-based access, and integration with various data sources are crucial for supporting expansion.
This flexibility ensures that as your operations evolve, your analytics continue to deliver relevant, actionable insights.
Data Privacy and Compliance in 2025
As your e commerce analysis report becomes more sophisticated, so do privacy and compliance demands. Adhering to regulations like GDPR and CCPA is non-negotiable, requiring secure data handling and transparent analytics practices.
Modern reporting tools offer built-in compliance features, such as data anonymization and audit trails. Building customer trust through ethical data use is not only a legal obligation but also a competitive differentiator.
A focus on privacy ensures your data-driven growth strategies are sustainable and future-proof.
Turning Analysis into Action: Strategies for E-Commerce Growth
Transforming insights from your e commerce analysis report into practical strategies is the key to unlocking sustainable growth. Knowing what the data says is only the first step. Success in 2025 hinges on acting quickly and confidently on those insights. Let us explore actionable methods to drive revenue, improve customer experience, and outpace competitors.
Data-Driven Product Recommendations and Bundling
A well-structured e commerce analysis report helps you identify high-converting product combinations and personalized recommendations. By analyzing purchase history and customer behavior, you can discover which items are frequently bought together and create dynamic product bundles.
This approach not only boosts average order value but also enhances the customer experience. For example, recommending complementary accessories at checkout or offering curated bundles for specific segments can increase conversion rates. Use predictive analytics to refine these offers over time, ensuring relevance and appeal for each audience.
Optimizing Store Layout and User Experience
The insights from an e commerce analysis report are essential for refining your store’s layout and improving the overall user journey. By examining heatmaps and clickstream data, you can pinpoint bottlenecks in your checkout process or identify underperforming product pages.
Small tweaks to navigation, product placement, and checkout flow can significantly reduce cart abandonment rates. Regularly test new layouts and monitor user behavior to ensure your site remains intuitive and efficient. Prioritize mobile optimization, as device segmentation often reveals unique opportunities for growth.
Targeted Marketing and Retargeting Campaigns
Your e commerce analysis report enables precise segmentation for marketing initiatives. By analyzing customer cohorts, browsing history, and purchase patterns, you can deliver highly targeted email and advertising campaigns.
Personalized messaging increases engagement and drives higher transaction rates. Retargeting strategies, such as displaying ads for abandoned cart items or sending follow-up emails after specific actions, help recapture lost sales. Statistics show that personalized emails can deliver six times higher transaction rates, making targeted outreach a powerful growth lever.
Inventory and Supply Chain Optimization
An accurate e commerce analysis report empowers you to align inventory levels with demand forecasts, reducing both stockouts and overstock. By leveraging predictive analytics, you can automate reorder triggers and optimize supply chain operations for efficiency.
Advanced reporting tools help identify fast-moving products and slow sellers, allowing for better inventory prioritization. For a deeper dive into predictive analytics and best practices, explore Data-Driven Inventory Management in E-Commerce, which outlines how leading brands reduce costs while meeting customer expectations.
Customer Retention and Loyalty Enhancement
Use your e commerce analysis report to segment customers by purchase frequency, lifetime value, and churn risk. Cohort analysis helps you identify at-risk groups and craft tailored retention campaigns, such as loyalty programs or personalized incentives.
Post-purchase follow-ups and exclusive offers for repeat buyers can significantly improve retention rates. By continuously monitoring these metrics, you can proactively address pain points and strengthen long-term relationships, ensuring your brand remains top-of-mind in a crowded market.
Continuous Improvement and A/B Testing
Continuous optimization is only possible with a robust e commerce analysis report guiding your decisions. Set up ongoing A/B tests for pricing, product pages, and promotional messaging, tracking the impact of each variation.
Leverage real-time dashboards and automated reporting tools to measure outcomes and iterate quickly. For those seeking to enhance their reporting capabilities, Understanding Google Analytics for e-commerce provides practical tips for tracking and interpreting results, ensuring every test leads to measurable improvements.
Future Trends in E-Commerce Analysis and Reporting for 2025
The future of the e commerce analysis report is shaped by rapid advancements in technology, evolving consumer expectations, and a growing focus on responsible business practices. As we look ahead, four key trends will define how e-commerce brands use data to drive growth, deepen customer relationships, and maintain trust.
AI and Automation in Reporting
AI and automation are transforming the e commerce analysis report landscape. Self-service analytics tools now leverage machine learning to surface real-time insights, forecast trends, and automate reporting tasks. Predictive and prescriptive analytics are becoming standard, helping businesses optimize campaigns and inventory before issues arise. According to the E-Commerce Data Science Growth in 2025 report, demand for data science professionals in e-commerce is surging, reflecting the need for advanced analytical skills. Automated suggestions for campaign optimization are now common, empowering teams to act swiftly and strategically.
Omnichannel and Unified Data Analytics
The evolution of the e commerce analysis report centers on integrating online, offline, and marketplace data. Brands need a unified view of customer interactions across every touchpoint. By consolidating data from websites, physical stores, and third-party platforms, businesses can create holistic reports that reveal the true customer journey. A single customer view enables precise attribution, better segmentation, and more effective personalization. For example, unified dashboards now track purchases made both in-store and online, giving decision-makers comprehensive insights for smarter strategy and resource allocation.
Personalization and Customer Experience Analytics
Deep personalization is now expected in every e commerce analysis report. Real-time tracking of customer behavior, preferences, and engagement metrics allows brands to tailor experiences instantly. Metrics such as Net Promoter Score, session duration, and abandoned cart recovery rates help measure satisfaction and refine touchpoints. As highlighted in E-Commerce Trends 2025: The Future of Online Shopping, 80% of shoppers are more likely to buy from brands that personalize their experience. In 2025, analytics will continue to drive hyper-personalization, making every interaction feel unique and relevant.
Sustainability and Ethical Data Use
Sustainability has become an integral part of the e commerce analysis report. Brands are increasingly tracking and reporting on metrics like carbon footprint, ethical sourcing, and waste reduction. Transparency is key, as consumers demand to know how their purchases impact the planet. Ethical data use is equally important; compliance with regulations such as GDPR and CCPA is non-negotiable. Analytics tools are evolving to prioritize secure data handling and customer privacy, building trust while supporting green business practices. Responsible reporting practices will help brands stand out and foster long-term loyalty.